
Last major update issued on November 8, 2003 at 04:45 UTC.
[Solar and geomagnetic data - last month (updated daily)]
[Solar wind and electron fluence charts (updated daily)]
[Solar cycles 21-23 (last update November 4, 2003)]
[Solar cycles 1-20]
[Graphical comparison of cycles 21, 22 and 23 (last update November 4, 2003)]
[Graphical comparison of cycles 2, 10, 13, 17, 20 and 23 (last update November
4, 2003)]
[Historical solar and geomagnetic data charts 1954-2003 (last update October 15, 2003)]
[Archived reports (last update November 5, 2003)]
The geomagnetic field was quiet to unsettled on November 7. Solar wind speed ranged between 395 and 582 km/sec, generally decreasing all day.
Solar flux measured at 20h UTC on 2.8 GHz was 91.0 (lowest since the previous solar minimum, just over a week after the
highest solar flux during cycle 23 had been recorded). The planetary A
index was 8 (STAR Ap - based on the mean of three hour interval ap indices: 9.5).
Three hour interval K indices: 32123322 (planetary), 32121222 (Boulder).
The background x-ray flux is at the class B1 level.
At midnight there were no regions with spots on the visible disk. Solar flare activity was very low.
November 7: A full halo CME was observed beginning in LASCO C3 images at 16:18 UTC. The distribution of the ejected material suggests that the source of this CME was old region 10486 behind the southwest limb.
November 6: A large full halo CME was observed in LASCO C3 images beginning at 17:42 UTC. The source of this CME was likely 5-6 days behind the southeast limb. This source was probably the same as the one which produced another backsided large full halo CME on November 4, probably old region 10484.
November 5: No partially or fully Earth directed CMEs observed.
Coronal hole history (since late October 2002)
Compare today's report with the situation one solar rotation ago: 28
days ago 27 days ago 26 days ago
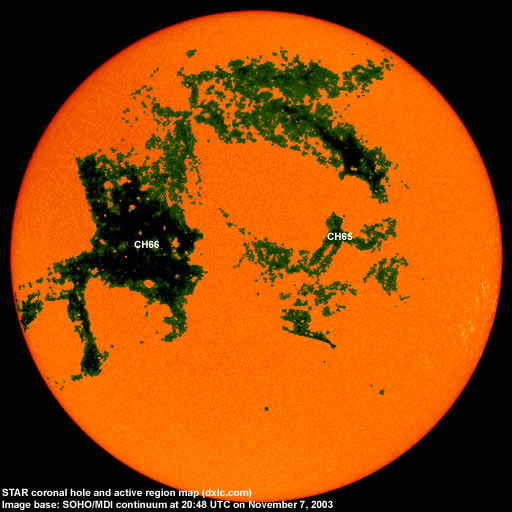
A small and poorly defined coronal hole (CH65) in the northern hemisphere with a trans equatorial extension may have been in a geoeffective position on November 5-6. A well defined recurrent trans equatorial coronal hole (CH66) will reach a geoeffective position on November 9-13.
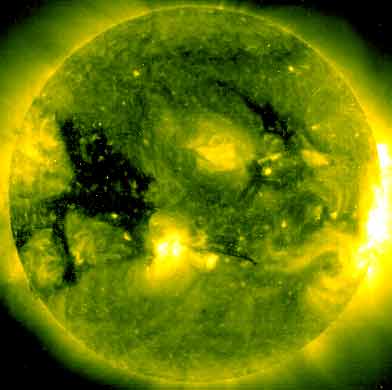
Processed SOHO/EIT 284 image at 19:53 UTC on November 7. The darkest areas on the solar disk are likely coronal holes.
The geomagnetic field is expected to be quiet to unsettled on November 8-9, possibly with a few active intervals due to a high speed stream from coronal hole CH65. Unsettled to major storm conditions are likely on November 12-16 under the influence of a high speed stream from coronal hole CH66.
Long distance low frequency (below 2 MHz) propagation along east-west paths over high and upper middle latitudes is poor. Propagation along long distance north-south paths is very poor. [Trans Atlantic propagation conditions are currently monitored every night on 1470 kHz. Dominant station: only a weak signal from Radio Vibraci�n (Venezuela) observed. Some stations from Newfoundland were noted on other frequencies].
| Coronal holes (1) | Coronal mass ejections (2) | M and X class flares (3) |
1) Effects from a coronal hole could reach Earth within the next 5 days.
2) Material from a CME is likely to impact Earth within 96 hours.
3) There is a possibility of either M or X class flares within the next 48 hours.
Green: 0-20% probability, Yellow: 20-60% probability, Red: 60-100% probability.
Compare to the previous day's image.
Data for all numbered solar regions according to the Solar Region Summary provided by NOAA/SEC. Comments are my own, as is the STAR spot count (spots observed at or inside a few hours before midnight) and data for regions not numbered by SEC or where SEC has observed no spots.
| Solar region | Date numbered | SEC spot count |
STAR spot count |
Location at midnight | Area | Classification | Comment |
|---|---|---|---|---|---|---|---|
| 10495 | 2003.10.30 | 1 | S18W89 | 0120 | HSX | rotated out of view | |
| 10496 | 2003.10.31 | S12W82 | plage | ||||
| 10497 | 2003.11.04 | N10W84 | plage | ||||
| S294 | emerged on 2003.10.29 |
S09W72 | plage | ||||
| S296 | emerged on 2003.11.01 |
S07W52 | plage | ||||
| S297 | emerged on 2003.11.03 |
N12W45 | plage | ||||
| S298 | emerged on 2003.11.03 |
N13W51 | plage | ||||
| S299 | emerged on 2003.11.04 |
S22W71 | plage | ||||
| Total spot count: | 1 | 0 | |||||
| SSN: | 11 | 0 | |||||
| Month | Average solar flux at Earth |
International sunspot number | Smoothed sunspot number |
|---|---|---|---|
| 2000.04 | 184.2 | 125.5 | 120.8 cycle 23 sunspot max. |
| 2000.07 | 202.3 | 170.1 | 119.8 |
| 2001.12 | 235.1 | 132.2 | 114.6 (-0.9) |
| 2002.10 | 167.0 | 97.5 | 90.5 (-4.1) |
| 2002.11 | 168.7 | 95.5 | 85.2 (-5.3) |
| 2002.12 | 157.2 | 80.8 | 82.0 (-3.2) |
| 2003.01 | 144.0 | 79.7 | 80.9 (-1.1) |
| 2003.02 | 124.5 | 46.0 | 78.5 (-2.4) |
| 2003.03 | 131.4 | 61.1 | 74.1 (-4.4) |
| 2003.04 | 126.4 | 60.0 | 70.3 (-3.8) |
| 2003.05 | 115.7 | 55.2 | (66.8 predicted, -3.5) |
| 2003.06 | 129.3 | 77.4 | (63.0 predicted, -3.8) |
| 2003.07 | 127.7 | 85.0 | (59.3 predicted, -3.7) |
| 2003.08 | 122.1 | 72.7 | (56.3 predicted, -3.0) |
| 2003.09 | 112.2 | 48.8 | (54.3 predicted, -2.0) |
| 2003.10 | 151.7 | 65.6 | (51.6 predicted, -2.7) |
| 2003.11 | 148.4 (1) | 22.0 (2) | (48.9 predicted, -2.7) |
1) Running average based on the daily 20:00 UTC observed solar flux value at 2800 MHz.
2) Unofficial, accumulated value based on the Boulder (NOAA/SEC) sunspot number. The official international sunspot number is typically
30-50% less.
This report has been prepared by Jan Alvestad. It is based partly on my own observations and analysis, and partly on data from sources noted in solar links. All time references are to the UTC day. Comments and suggestions are always welcome.
| [DX-Listeners' Club] |