
Last update issued on October 2, 2003 at 03:55 UTC.
[Solar and geomagnetic data - last month (updated daily)]
[Solar wind and electron fluence charts (updated daily)]
[Solar cycles 21-23 (last update September 1, 2003)]
[Solar cycles 1-20]
[Graphical comparison of cycles 21, 22 and 23 (last update September 1, 2003)]
[Graphical comparison of cycles 2, 10, 13, 17, 20 and 23 (last update September
1, 2003)]
[Historical solar and geomagnetic data charts 1954-2003 (last update July 23, 2003)]
[Archived reports (last update September 29, 2003)]
The geomagnetic field was quiet to unsettled on October 1. Solar wind speed ranged between 276 and 326 km/sec. A disturbance arrived at ACE at approximately 16h UTC. At first the interplanetary magnetic field was weakly southwards, then became moderately to strongly southwards between 19 and 21h UTC. After 21h UTC the IMF has been northwards. At the current strength of the total field a sustained southward swing could cause at least minor storm conditions. Solar wind speed has only increased slightly since the arrival of the disturbance.
Solar flux measured at 20h UTC on 2.8 GHz was 136.8 The planetary A
index was 10 (STAR Ap - based on the mean of three hour interval ap indices: 11.5).
Three hour interval K indices: 32232233 (planetary), 32222234 (Boulder).
The background x-ray flux is at the class B4 level.
At midnight there were 5 spotted regions on the visible disk. Solar flare activity was moderate. A total of 6 C and 1 M class events was recorded during the day. A C1.4 flare at 07:20 and a C1.2 flare at 09:15 UTC was optically uncorrelated.
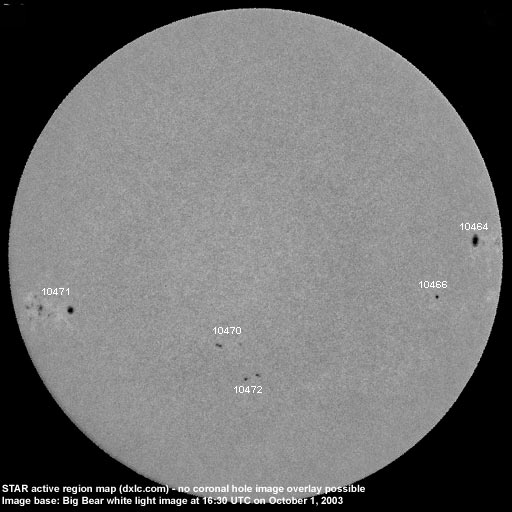
Region 10464 decayed slowly and will be rotating over the northwest limb today and tomorrow. Flares:
C3.3 at 04:24, M1.4/1F at 04:51 and C1.6 at 17:52 UTC.
Region 10466 was quiet and stable.
Region 10470 developed early in the day, then decayed slowly. Flare: C1.6 long
duration event peaking at 19:52 UTC.
Region 10471 developed slowly and was mostly quiet. The region has mixed polarities and could produce minor M class
flares.
New region 10472 emerged in the southeast quadrant on September 29 and was numbered by SEC 2 days later.
September 29 - October 1: No potentially geoeffective CMEs observed.
Coronal hole history (since late October 2002)
Compare today's report with the situation one solar rotation ago: 28
days ago 27 days ago 26 days ago
No obvious coronal holes are currently approaching geoeffective positions.
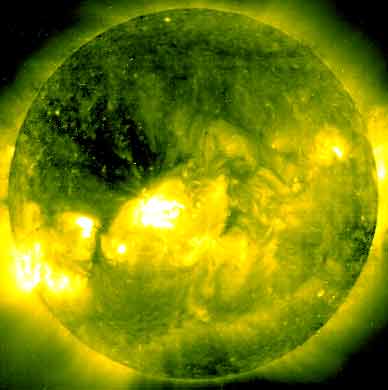
Processed SOHO/EIT 284 image at 19:06 UTC on September 25. The darkest areas on the solar disk are likely coronal holes.
The geomagnetic field is expected to be mostly quiet to unsettled October 2-6, isolated active intervals are possible on October 2-3.
Long distance low frequency (below 2 MHz) propagation along east-west paths over high and upper middle latitudes is fair. Propagation along north-south paths is fair. [Trans Atlantic propagation conditions are currently monitored every night on 1470 kHz. Dominant station tonight: Radio Vibraci�n (Venezuela). On 1510 kHz WWZN Boston had a strong signal].
| Coronal holes (1) | Coronal mass ejections (2) | M and X class flares (3) |
1) Effects from a coronal hole could reach Earth within the next 5 days.
2) Material from a CME is likely to impact Earth within 96 hours.
3) There is a possibility of either M or X class flares within the next 48 hours.
Green: 0-20% probability, Yellow: 20-60% probability, Red: 60-100% probability.
Compare to the previous day's image.
Data for all numbered solar regions according to the Solar Region Summary provided by NOAA/SEC. Comments are my own, as is the STAR spot count (spots observed at or inside a few hours before midnight) and data for regions not numbered by SEC or where SEC has observed no spots.
| Solar region | Date numbered | SEC spot count |
STAR spot count |
Location at midnight | Area | Classification | Comment |
|---|---|---|---|---|---|---|---|
| 10464 | 2003.09.20 | 16 | 14 | N05W73 | 0480 | FKI |
beta-gamma classification was FAO at midnight, area 0320 |
| 10465 | 2003.09.22 | S02W71 | plage | ||||
| 10466 | 2003.09.22 | 4 | 2 | S04W50 | 0030 | CSO | |
| 10467 | 2003.09.23 | 3 | S11W58 (SEC: S05W51) |
0030 | DSO |
region is spotless, SEC has duplicated the data for region 10466! |
|
| 10469 | 2003.09.27 | 1 | S09W82 | 0040 | HSX | rotated out of view | |
| 10470 | 2003.09.29 | 7 | 7 | S13E04 | 0030 | DSO |
classification was CAO at midnight |
| 10471 | 2003.09.30 | 20 | 23 | S08E53 | 0330 | FSI | beta-gamma |
| 10472 | 2003.10.30 | 5 | 9 | S23W02 | 0020 | DSO |
formerly region S265 classification was DAO at midnight, area 0050 |
| S261 | emerged on 2003.09.23 |
S08W88 | plage | ||||
| S267 | emerged on 2003.09.29 |
S18E15 | plage | ||||
| S268 | emerged on 2003.09.30 |
N25W25 | plage | ||||
| Total spot count: | 56 | 55 | |||||
| SSN: | 126 | 105 | |||||
| Month | Average solar flux at Earth |
International sunspot number | Smoothed sunspot number |
|---|---|---|---|
| 2000.04 | 184.2 | 125.5 | 120.8 cycle 23 sunspot max. |
| 2000.07 | 202.3 | 170.1 | 119.8 |
| 2001.12 | 235.1 | 132.2 | 114.6 (-0.9) |
| 2002.08 | 183.6 | 116.4 | 98.7 (-4.0) |
| 2002.09 | 175.8 | 109.6 | 94.6 (-4.1) |
| 2002.10 | 167.0 | 97.5 | 90.5 (-4.1) |
| 2002.11 | 168.7 | 95.5 | 85.2 (-5.3) |
| 2002.12 | 157.2 | 80.8 | 82.0 (-3.2) |
| 2003.01 | 144.0 | 79.7 | 80.9 (-1.1) |
| 2003.02 | 124.5 | 46.0 | 78.5 (-2.4) |
| 2003.03 | 131.4 | 61.1 | 74.1 (-4.4) |
| 2003.04 | 126.4 | 60.0 | (69.6 predicted, -4.5) |
| 2003.05 | 115.7 | 55.2 | (65.3 predicted, -4.3) |
| 2003.06 | 129.3 | 77.4 | (61.5 predicted, -3.8) |
| 2003.07 | 127.7 | 85.0 | (58.0 predicted, -3.5) |
| 2003.08 | 122.1 | 72.7 | (55.0 predicted, -3.0) |
| 2003.09 | 112.2 | 48.8 | (53.0 predicted, -2.0) |
| 2003.10 | 136.8 (1) | 4.1 (2) | (50.3 predicted, -2.7) |
1) Running average based on the daily 20:00 UTC observed solar flux value at 2800 MHz.
2) Unofficial, accumulated value based on the Boulder (NOAA/SEC) sunspot number. The official international sunspot number is typically
30-50% less.
This report has been prepared by Jan Alvestad. It is based partly on my own observations and analysis, and partly on data from sources noted in solar links. All time references are to the UTC day. Comments and suggestions are always welcome.
| [DX-Listeners' Club] |