
Last update issued on October 4, 2003 at 04:10 UTC.
[Solar and geomagnetic data - last month (updated daily)]
[Solar wind and electron fluence charts (updated daily)]
[Solar cycles 21-23 (last update October 4, 2003)]
[Solar cycles 1-20]
[Graphical comparison of cycles 21, 22 and 23 (last update October 4, 2003)]
[Graphical comparison of cycles 2, 10, 13, 17, 20 and 23 (last update October
4, 2003)]
[Historical solar and geomagnetic data charts 1954-2003 (last update July 23, 2003)]
[Archived reports (last update September 29, 2003)]
The geomagnetic field was quiet to minor storm on October 3. Solar wind speed ranged between 465 and 572 km/sec.
Solar flux measured at 20h UTC on 2.8 GHz was 120.1. The planetary A
index was 16 (STAR Ap - based on the mean of three hour interval ap indices: 17.1).
Three hour interval K indices: 35333332 (planetary), 35223422 (Boulder).
The background x-ray flux is at the class B3 level.
At midnight there were 3 spotted regions on the visible disk. Solar flare activity was low. A total of 6 C class events was recorded during the day. Optically un correlated flares: C1.0 at 06:19, C1.4 at 06:44, C2.1 at 12:18 and C2.7 at 23:14 UTC.
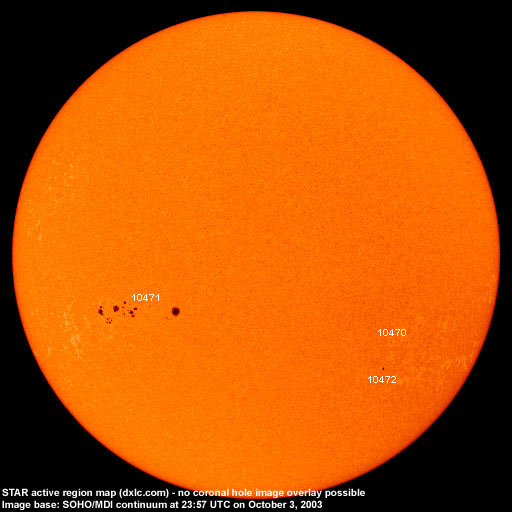
Region 10470 redeveloped spots early in the day, then decayed and had only a single small spot left at midnight.
Region 10471 developed slowly and has a magnetic delta structure in the largest trailing penumbra. A minor M class flare
is possible. Flares: C2.0 at 03:38 and C1.7 at 07:57 UTC.
Region 10472 decayed fairly quickly and could become spotless within a couple of days.
October 1-3: No potentially geoeffective CMEs observed.
Coronal hole history (since late October 2002)
Compare today's report with the situation one solar rotation ago: 28
days ago 27 days ago 26 days ago
No obvious coronal holes are currently approaching geoeffective positions.
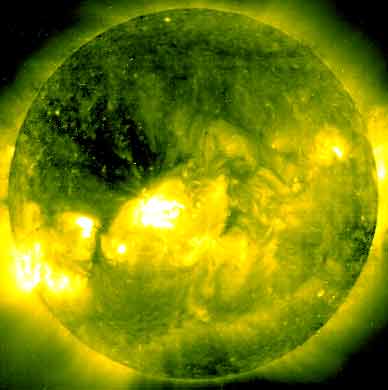
Processed SOHO/EIT 284 image at 19:06 UTC on September 25. The darkest areas on the solar disk are likely coronal holes.
The geomagnetic field is expected to be quiet to unsettled October 4-6.
Long distance low frequency (below 2 MHz) propagation along east-west paths over high and upper middle latitudes is poor to fair. Propagation along north-south paths is fair to good. [Trans Atlantic propagation conditions are currently monitored every night on 1470 kHz. Dominant stations tonight: Radio Vibración (Venezuela) at first, then Cadena Peruana de Noticias gradually becoming dominant. At least 2 other Spanish speaking stations were noted on the frequency].
| Coronal holes (1) | Coronal mass ejections (2) | M and X class flares (3) |
1) Effects from a coronal hole could reach Earth within the next 5 days.
2) Material from a CME is likely to impact Earth within 96 hours.
3) There is a possibility of either M or X class flares within the next 48 hours.
Green: 0-20% probability, Yellow: 20-60% probability, Red: 60-100% probability.
Compare to the previous day's image.
Data for all numbered solar regions according to the Solar Region Summary provided by NOAA/SEC. Comments are my own, as is the STAR spot count (spots observed at or inside a few hours before midnight) and data for regions not numbered by SEC or where SEC has observed no spots.
| Solar region | Date numbered | SEC spot count |
STAR spot count |
Location at midnight | Area | Classification | Comment |
|---|---|---|---|---|---|---|---|
| 10464 | 2003.09.20 | 1 | N06W91 | 0170 | HSX | rotated out of view | |
| 10466 | 2003.09.22 | 1 | S05W78 | 0010 | AXX | spotless | |
| 10467 | 2003.09.23 | S11W84 (SEC: S05W77) |
|||||
| 10470 | 2003.09.29 | 5 | 1 | S17W26 | 0020 | CSO |
classification was AXX at midnight, area 0010 |
| 10471 | 2003.09.30 | 31 | 33 | S08E29 (SEC: S08E35) |
0200 | EAI |
beta-gamma-delta classification was FAI at midnight, area 0450 SEC has split off leader spots into region 10473 |
| 10472 | 2003.10.01 | 5 | 1 | S22W31 | 0020 | CAO |
classification was HSX at midnight |
| 10473 | 2003.10.03 | 1 | S07E20 | 0100 | HSX |
leader spot of region 10471. 10473 only has a large negative polarity area, with the corresponding large positive polarity area located in region 10471 |
|
| S267 | emerged on 2003.09.29 |
S18W11 | plage | ||||
| S268 | emerged on 2003.09.30 |
N25W51 | plage | ||||
| S269 | emerged on 2003.10.02 |
N10W10 | plage | ||||
| Total spot count: | 44 | 35 | |||||
| SSN: | 104 | 65 | |||||
| Month | Average solar flux at Earth |
International sunspot number | Smoothed sunspot number |
|---|---|---|---|
| 2000.04 | 184.2 | 125.5 | 120.8 cycle 23 sunspot max. |
| 2000.07 | 202.3 | 170.1 | 119.8 |
| 2001.12 | 235.1 | 132.2 | 114.6 (-0.9) |
| 2002.08 | 183.6 | 116.4 | 98.7 (-4.0) |
| 2002.09 | 175.8 | 109.6 | 94.6 (-4.1) |
| 2002.10 | 167.0 | 97.5 | 90.5 (-4.1) |
| 2002.11 | 168.7 | 95.5 | 85.2 (-5.3) |
| 2002.12 | 157.2 | 80.8 | 82.0 (-3.2) |
| 2003.01 | 144.0 | 79.7 | 80.9 (-1.1) |
| 2003.02 | 124.5 | 46.0 | 78.5 (-2.4) |
| 2003.03 | 131.4 | 61.1 | 74.1 (-4.4) |
| 2003.04 | 126.4 | 60.0 | (69.6 predicted, -4.5) |
| 2003.05 | 115.7 | 55.2 | (65.3 predicted, -4.3) |
| 2003.06 | 129.3 | 77.4 | (61.5 predicted, -3.8) |
| 2003.07 | 127.7 | 85.0 | (58.0 predicted, -3.5) |
| 2003.08 | 122.1 | 72.7 | (55.0 predicted, -3.0) |
| 2003.09 | 112.2 | 48.8 | (53.0 predicted, -2.0) |
| 2003.10 | 127.2 (1) | 9.8 (2) | (50.3 predicted, -2.7) |
1) Running average based on the daily 20:00 UTC observed solar flux value at 2800 MHz.
2) Unofficial, accumulated value based on the Boulder (NOAA/SEC) sunspot number. The official international sunspot number is typically
30-50% less.
This report has been prepared by Jan Alvestad. It is based partly on my own observations and analysis, and partly on data from sources noted in solar links. All time references are to the UTC day. Comments and suggestions are always welcome.
| [DX-Listeners' Club] |