
Last update issued on September 22, 2003 at 03:00 UTC.
[Solar and geomagnetic data - last month (updated daily)]
[Solar wind and electron fluence charts (updated daily)]
[Solar cycles 21-23 (last update September 1, 2003)]
[Solar cycles 1-20]
[Graphical comparison of cycles 21, 22 and 23 (last update September 1, 2003)]
[Graphical comparison of cycles 2, 10, 13, 17, 20 and 23 (last update September
1, 2003)]
[Historical solar and geomagnetic data charts 1954-2003 (last update July 23, 2003)]
[Archived reports (last update September 16, 2003)]
The geomagnetic field was unsettled to minor storm on September 21. Solar wind speed ranged between 475 and 671 km/sec under the influence of a high speed stream from coronal hole CH57. Towards the end of the day there may have been a transition to a high speed stream from coronal hole CH59.
Solar flux measured at 20h UTC on 2.8 GHz was 119.9. The planetary A
index was 21 (STAR Ap - based on the mean of three hour interval ap indices: 21.3).
Three hour interval K indices: 43445433 (planetary), 43434422 (Boulder).
The background x-ray flux is at the class B3 level.
At midnight there were 5 spotted regions on the visible disk. Solar flare activity was low. A total of 5 C class events was recorded during the day. A C1.0 flare at 04:07 and a C1.2 event at 13:33 UTC were optically uncorrelated.
Region 10459 decayed slowly and was mostly quiet.
Region 10460 developed early in the day, then decayed again and could soon become spotless.
Region 10463 was quiet and stable.
Region 10464 developed slowly and seems to have a weak magnetic delta structure at the eastern edge of the leading
penumbra. Minor M class flares are possible. Flares: C1.4 at 00:08, C1.1 at 00:28 and C1.8 at
02:30 UTC.
Spotted regions not numbered by NOAA/SEC:
[S259] A new region rotated partially into view at the southeast limb late on September 21. Location at midnight:
S05E82.
September 19-21: No potentially geoeffective CMEs observed. Large backsided CMEs were observed on both September 20 and 21.
Coronal hole history (since late October 2002)
Compare today's report with the situation one solar rotation ago: 28
days ago 27 days ago 26 days ago
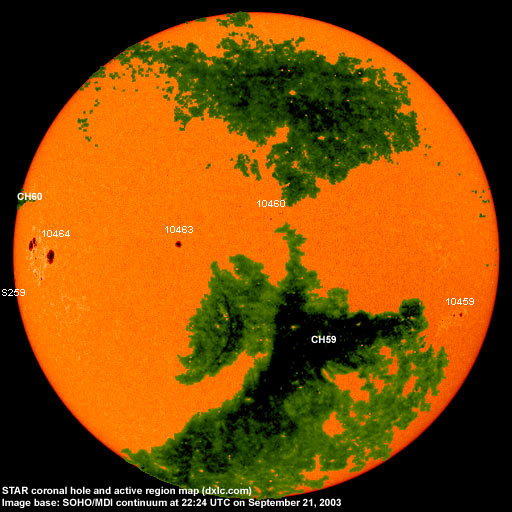
An elongated coronal hole (CH59) in the southern hemisphere was in a geoeffective position on September 18-21. A coronal hole (CH60) in the northern hemisphere is currently rotating into view at the east limb.
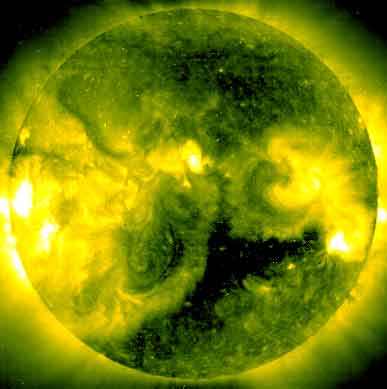
Processed SOHO/EIT 184 image at 19:06 UTC on September 21. The darkest areas on the solar disk are likely coronal holes.
The geomagnetic field is expected to be unsettled to active until September 24 due to a high speed stream from coronal hole CH59.
Long distance low frequency (below 2 MHz) propagation along east-west paths over high and upper middle latitudes is very poor. Propagation along north-south paths is very poor. [Trans Atlantic propagation conditions are currently monitored every night on 1470 kHz. Dominant station tonight: Radio Cristal del Uruguay with a weak signal].
| Coronal holes (1) | Coronal mass ejections (2) | M and X class flares (3) |
1) Effects from a coronal hole could reach Earth within the next 5 days.
2) Material from a CME is likely to impact Earth within 96 hours.
3) There is a possibility of either M or X class flares within the next 48 hours.
Green: 0-20% probability, Yellow: 20-60% probability, Red: 60-100% probability.
Compare to the previous day's image.
Data for all numbered solar regions according to the Solar Region Summary provided by NOAA/SEC. Comments are my own, as is the STAR spot count (spots observed at or inside a few hours before midnight) and data for regions not numbered by SEC or where SEC has observed no spots.
| Solar region | Date numbered | SEC spot count |
STAR spot count |
Location at midnight | Area | Classification | Comment |
|---|---|---|---|---|---|---|---|
| 10459 | 2003.09.14 | 7 | 6 | S11W56 | 0080 | CSO |
area was 0050 at midnight |
| 10460 | 2003.09.15 | 6 | 5 | N17W05 | 0010 | BXO |
classification was AXX at midnight |
| 10463 | 2003.09.17 | 1 | 2 | N09E18 | 0070 | HSX | |
| 10464 | 2003.09.20 | 10 | 22 | N03E62 | 0460 | EKO | beta-gamma-delta |
| S259 | visible on 2003.09.21 |
2 | S05E82 | 0030 | HSX | ||
| Total spot count: | 24 | 37 | |||||
| SSN: | 64 | 87 | |||||
| Month | Average solar flux at Earth |
International sunspot number | Smoothed sunspot number |
|---|---|---|---|
| 2000.04 | 184.2 | 125.5 | 120.8 cycle 23 sunspot max. |
| 2000.07 | 202.3 | 170.1 | 119.8 |
| 2001.12 | 235.1 | 132.2 | 114.6 (-0.9) |
| 2002.08 | 183.6 | 116.4 | 98.7 (-4.0) |
| 2002.09 | 175.8 | 109.6 | 94.6 (-4.1) |
| 2002.10 | 167.0 | 97.5 | 90.5 (-4.1) |
| 2002.11 | 168.7 | 95.5 | 85.2 (-5.3) |
| 2002.12 | 157.2 | 80.8 | 82.0 (-3.2) |
| 2003.01 | 144.0 | 79.7 | 81.0 (-1.0) |
| 2003.02 | 124.5 | 46.0 | 78.5 (-2.5) |
| 2003.03 | 131.4 | 61.1 | (74.2 predicted, -4.3) |
| 2003.04 | 126.4 | 60.0 | (69.3 predicted, -4.9) |
| 2003.05 | 115.7 | 55.2 | (64.4 predicted, -4.9) |
| 2003.06 | 129.3 | 77.4 | (60.4 predicted, -4.0) |
| 2003.07 | 127.7 | 85.0 | (56.9 predicted, -3.5) |
| 2003.08 | 122.1 | 72.7 | (53.9 predicted, -3.0) |
| 2003.09 | 104.2 (1) | 45.5 (2) | (51.9 predicted, -2.0) |
1) Running average based on the daily 20:00 UTC observed solar flux value at 2800 MHz.
2) Unofficial, accumulated value based on the Boulder (NOAA/SEC) sunspot number. The official international sunspot number is typically
30-50% less.
This report has been prepared by Jan Alvestad. It is based partly on my own observations and analysis, and partly on data from sources noted in solar links. All time references are to the UTC day. Comments and suggestions are always welcome.
| [DX-Listeners' Club] |