
Last update issued on September 28, 2003 at 03:30 UTC.
[Solar and geomagnetic data - last month (updated daily)]
[Solar wind and electron fluence charts (updated daily)]
[Solar cycles 21-23 (last update September 1, 2003)]
[Solar cycles 1-20]
[Graphical comparison of cycles 21, 22 and 23 (last update September 1, 2003)]
[Graphical comparison of cycles 2, 10, 13, 17, 20 and 23 (last update September
1, 2003)]
[Historical solar and geomagnetic data charts 1954-2003 (last update July 23, 2003)]
[Archived reports (last update September 16, 2003)]
The geomagnetic field was quiet to unsettled on September 27. Solar wind speed ranged between 439 and 546 km/sec.
Solar flux measured at 20h UTC on 2.8 GHz was 129.7. The planetary A
index was 9 (STAR Ap - based on the mean of three hour interval ap indices: 10.0).
Three hour interval K indices: 32232222 (planetary), 30112222 (Boulder).
The background x-ray flux is at the class B3 level.
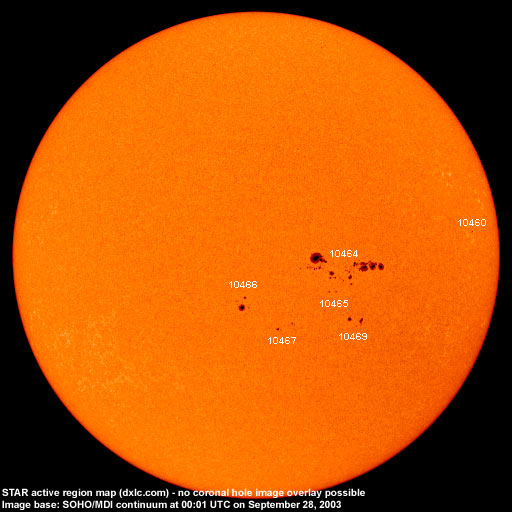
At midnight there were 6 spotted regions on the visible disk. Solar flare activity was low. A total of 2 C class events was recorded during the day.
Region 10463 decayed slowly and quietly, the region could become spotless before rotating over the northwest limb on
September 29.
Region 10464 decayed significantly in the intermediate spot section. During the last few hours of the day a positive
polarity area emerged at the western edge of the large trailing negative polarity spot. This caused a magnetic delta structure to
develop. A negative polarity area emerged just northeast of the easternmost leading positive polarity spot. Further development in
this area could cause another magnetic delta to form. M class flares are possible. Flares:
C1.3 at 11:43 and C1.3 at 12:04 UTC.
Region 10465 reemerged with a few spots.
Region 10466 was mostly unchanged and quiet.
Region 10467 changed slightly with the main negative and positive polarity areas drifting apart.
New region 10469 emerged in the southwest quadrant on September 26 and was numbered by SEC the next day. The region
developed moderately quickly on September 27 but has a magnetically simple layout.
September 25-27: No potentially geoeffective CMEs observed.
Coronal hole history (since late October 2002)
Compare today's report with the situation one solar rotation ago: 28
days ago 27 days ago 26 days ago
A coronal hole (CH60) in the northern hemisphere was in a geoeffective position on September 26-28.

Processed SOHO/EIT 284 image at 19:06 UTC on September 25. The darkest areas on the solar disk are likely coronal holes.
The geomagnetic field is expected to be quiet to unsettled on September 28 becoming unsettled to active on September 29 - October 1 due to a high speed stream from coronal hole CH60.
Long distance low frequency (below 2 MHz) propagation along east-west paths over high and upper middle latitudes is poor. Propagation along north-south paths is poor. [Trans Atlantic propagation conditions are currently monitored every night on 1470 kHz. Dominant station tonight: none, several stations observed including Radio Vibraci�n (Venezuela) and an unidentified station from Colombia].
| Coronal holes (1) | Coronal mass ejections (2) | M and X class flares (3) |
1) Effects from a coronal hole could reach Earth within the next 5 days.
2) Material from a CME is likely to impact Earth within 96 hours.
3) There is a possibility of either M or X class flares within the next 48 hours.
Green: 0-20% probability, Yellow: 20-60% probability, Red: 60-100% probability.
Compare to the previous day's image.
Data for all numbered solar regions according to the Solar Region Summary provided by NOAA/SEC. Comments are my own, as is the STAR spot count (spots observed at or inside a few hours before midnight) and data for regions not numbered by SEC or where SEC has observed no spots.
| Solar region | Date numbered | SEC spot count |
STAR spot count |
Location at midnight | Area | Classification | Comment |
|---|---|---|---|---|---|---|---|
| 10460 | 2003.09.15 | N17W86 | plage | ||||
| 10463 | 2003.09.17 | 1 | 2 | N09W63 | 0020 | HSX |
classification was HRX at midnight, area 0010 |
| 10464 | 2003.09.20 | 54 | 63 | N05W20 | 0580 | FSI |
beta-gamma-delta
classification was FKI at midnight, area 0900 |
| 10465 | 2003.09.22 | 3 | 2 | S01W19 | 0010 | CRO | |
| 10466 | 2003.09.22 | 7 | 10 | S05E05 | 0070 | CSO |
classification was DSO at midnight, area 0100 |
| 10467 | 2003.09.23 | 6 | 5 | S10W06 | 0030 | DSO |
classification was CSO at midnight, area 0020 |
| 10468 | 2003.09.23 | N16W68 | plage | ||||
| 10469 | 2003.09.27 | 6 | 7 | S09W24 | 0020 | BXO |
formerly region S262 classification was DAO at midnight, area 0070 |
| S261 | emerged on 2003.09.23 |
S08W36 | plage | ||||
| Total spot count: | 77 | 89 | |||||
| SSN: | 137 | 149 | |||||
| Month | Average solar flux at Earth |
International sunspot number | Smoothed sunspot number |
|---|---|---|---|
| 2000.04 | 184.2 | 125.5 | 120.8 cycle 23 sunspot max. |
| 2000.07 | 202.3 | 170.1 | 119.8 |
| 2001.12 | 235.1 | 132.2 | 114.6 (-0.9) |
| 2002.08 | 183.6 | 116.4 | 98.7 (-4.0) |
| 2002.09 | 175.8 | 109.6 | 94.6 (-4.1) |
| 2002.10 | 167.0 | 97.5 | 90.5 (-4.1) |
| 2002.11 | 168.7 | 95.5 | 85.2 (-5.3) |
| 2002.12 | 157.2 | 80.8 | 82.0 (-3.2) |
| 2003.01 | 144.0 | 79.7 | 81.0 (-1.0) |
| 2003.02 | 124.5 | 46.0 | 78.5 (-2.5) |
| 2003.03 | 131.4 | 61.1 | (74.2 predicted, -4.3) |
| 2003.04 | 126.4 | 60.0 | (69.3 predicted, -4.9) |
| 2003.05 | 115.7 | 55.2 | (64.4 predicted, -4.9) |
| 2003.06 | 129.3 | 77.4 | (60.4 predicted, -4.0) |
| 2003.07 | 127.7 | 85.0 | (56.9 predicted, -3.5) |
| 2003.08 | 122.1 | 72.7 | (53.9 predicted, -3.0) |
| 2003.09 | 109.7 (1) | 69.8 (2) | (51.9 predicted, -2.0) |
1) Running average based on the daily 20:00 UTC observed solar flux value at 2800 MHz.
2) Unofficial, accumulated value based on the Boulder (NOAA/SEC) sunspot number. The official international sunspot number is typically
30-50% less.
This report has been prepared by Jan Alvestad. It is based partly on my own observations and analysis, and partly on data from sources noted in solar links. All time references are to the UTC day. Comments and suggestions are always welcome.
| [DX-Listeners' Club] |