
Last major update issued on April 6, 2004 at 03:35 UTC.
[Solar and geomagnetic data - last month (updated daily)]
[Solar wind and electron fluence charts (updated daily)]
[Solar cycles 21-23 (last update April 2, 2004)]
[Solar cycles 1-20]
[Graphical comparison of cycles 21, 22 and 23 (last update April 2, 2004)]
[Graphical comparison of cycles 2, 10, 13, 17, 20 and 23 (last update April 2, 2004)]
[Historical solar and geomagnetic data charts 1954-2003 (last update January 16,
2004)]
[Archived reports (last update April 5, 2004)]
The geomagnetic field was quiet to minor storm on April 5. Solar wind speed ranged between 359 and 464 km/sec. A high speed stream from coronal hole CH88 increasingly dominated the solar wind after 11h UTC.
Solar flux measured at 20h UTC on 2.8 GHz was 108.7. The planetary A
index was 14 (STAR Ap - based on the mean of three hour interval ap indices: 14.5).
Three hour interval K indices: 10013454 (planetary), 23323554 (Boulder).
The background x-ray flux is at the class B1-B2 level.
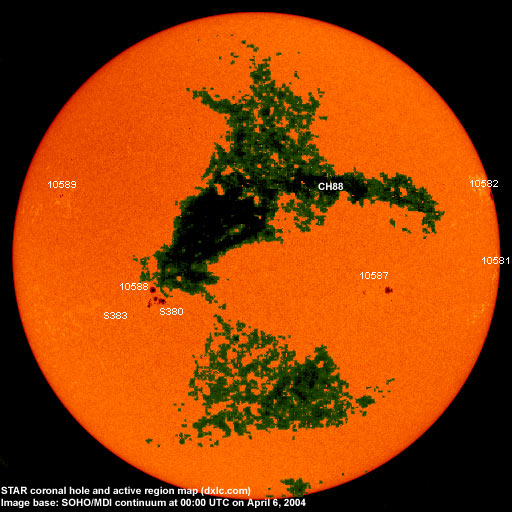
At midnight there were 7 spotted regions on the visible disk. The solar flare activity level was moderate. A single M class event was recorded during the day.
Region 10581 rotated quietly to the southwest limb.
Region 10582 rotated quietly to the northwest limb.
Region 10587 decayed slowly and quietly.
Region 10588 was quiet and stable.
New region 10589 rotated into view at the northeast limb on April 4 and was numbered by SEC the next day.
Spotted regions not numbered by NOAA/SEC:
[S380] This region emerged on April 3 just south of region 10588. The region developed
moderately quickly on April 4 and slowly on April 5. The leading penumbra has a magnetic delta structure and another minor M class
flare is possible. Location at midnight: S16E25. Flare: M1.7/1F at 05:55 UTC. This event
was associated with a weak type II radio sweep and a partial halo CME where most of the ejected material was observed off of the
southeast limb.
[S383] This region emerged to the southeast of region S380 on April 5 and had a single small spot at midnight. Location at midnight:
S19E30.
April 3-4: No fully or partly Earth directed CME observed.
April 5: A partial halo CME was observed after 06h UTC in LASCO images. The main ejecta was off of the southeast limb,
however, a faint front was seen around most of the visible disk. A weak solar wind shock is possible on April 8.
Coronal hole history (since late October 2002)
Compare today's report with the situation one solar rotation ago: 28
days ago 27 days ago 26 days ago
An elongated, recurrent trans equatorial coronal hole (CH88) will be in a geoeffective position on April 1-7. This coronal hole is best defined in the easternmost part.

Processed SOHO/EIT 284 image at 19:06 UTC on April 5. The darkest areas on the solar disk are likely coronal holes.
The geomagnetic field is expected to be unsettled to minor storm on April 6, quiet to active on April 7 and unsettled to minor storm on April 8-9 due to a high speed stream from coronal hole CH88.
Long distance low and medium frequency (below 2 MHz) propagation along east-west paths over high and upper middle latitudes is very poor. Propagation along long distance north-south paths is poor. [Trans Atlantic propagation conditions are currently monitored every night on 1470 kHz. Dominant stations tonight: Radio Cristal del Uruguay and CPN Radio (Per�). A weak signal from WWZN on 1510 was the only noted station from North America].
| Coronal holes (1) | Coronal mass ejections (2) | M and X class flares (3) |
1) Effects from a coronal hole could reach Earth within the next 5 days. When the high speed stream has arrived
the color changes to green.
2) Material from a CME is likely to impact Earth within 96 hours.
3) There is a possibility of either M or X class flares within the next 48 hours.
Green: 0-20% probability, Yellow: 20-60% probability, Red: 60-100% probability.
Compare to the previous day's image.
Data for all numbered solar regions according to the Solar Region Summary provided by NOAA/SEC. Comments are my own, as is the STAR spot count (spots observed at or inside a few hours before midnight) and data for regions not numbered by SEC or where SEC has observed no spots. SEC active region numbers in the table below and in the active region map above are the historic SEC/USAF numbers.
| Active region | Date numbered | SEC spot count |
STAR spot count |
Location at midnight | Area | Classification | Comment |
|---|---|---|---|---|---|---|---|
| 10581 | 2004.03.24 | 1 | 1 | S04W83 | 0040 | HSX | |
| 10582 | 2004.03.25 | 1 | 1 | N14W81 | 0120 | HSX | |
| 10585 | 2004.03.27 | S15W66 | plage | ||||
| 10587 | 2004.03.28 | 17 | 12 | S14W31 | 0140 | CAI | |
| 10588 | 2004.04.01 | 12 | 1 | S13E26 (SEC: S15E25) |
0170 | DAO |
SEC spot count, area and classification include region S380 |
| 10589 | 2004.04.05 | 4 | 7 | N10E54 | 0050 | BXO |
formerly region S381 classification was CRO at midnight, area 0020 |
| S380 | emerged on 2004.04.03 |
20 | S16E25 | 0130 | DAC |
beta-gamma-delta split off from region 10588 |
|
| S382 | emerged on 2004.04.04 |
N15W67 | plage | ||||
| S383 | emerged on 2004.04.05 |
1 | S19E30 | 0010 | AXX | ||
| Total spot count: | 35 | 43 | |||||
| SSN: | 85 | 113 | |||||
| Month | Average solar flux at Earth |
International sunspot number | Smoothed sunspot number |
|---|---|---|---|
| 2000.04 | 184.2 | 125.5 | 120.8 cycle 23 sunspot max. |
| 2000.07 | 202.3 | 170.1 | 119.8 |
| 2001.12 | 235.1 | 132.2 | 114.6 (-0.9) |
| 2003.03 | 131.4 | 61.1 | 74.0 (-4.3) |
| 2003.04 | 126.4 | 60.0 | 70.1 (-3.9) |
| 2003.05 | 115.7 | 55.2 | 67.6 (-2.5) |
| 2003.06 | 129.3 | 77.4 | 65.0 (-2.6) |
| 2003.07 | 127.7 | 83.3 | 61.8 (-3.2) |
| 2003.08 | 122.1 | 72.7 | 60.0 (-1.8) |
| 2003.09 | 112.2 | 48.7 | 59.5 (-0.5) |
| 2003.10 | 151.7 | 65.5 | (58.0 predicted, -1.5) |
| 2003.11 | 140.8 | 67.3 | (55.9 predicted, -2.1) |
| 2003.12 | 114.9 | 46.5 | (53.3 predicted, -2.6) |
| 2004.01 | 114.1 | 37.2 | (49.1 predicted, -4.2) |
| 2004.02 | 107.0 | 46.0 | (44.5 predicted, -4.6) |
| 2004.03 | 112.0 | 48.9 | (41.7 predicted, -2.8) |
| 2004.04 | 109.2 (1) | 14.0 (2) | (39.6 predicted, -2.1) |
1) Running average based on the daily 20:00 UTC observed solar flux value at 2800 MHz.
2) Unofficial, accumulated value based on the Boulder (NOAA/SEC) sunspot number. The official international sunspot number is typically
30-50% less.
This report has been prepared by Jan Alvestad. It is based partly on my own observations and analysis, and partly on data from some of these solar data sources. All time references are to the UTC day. Comments and suggestions are always welcome.
| [DX-Listeners' Club] |