
Last major update issued on April 16, 2004 at 03:45 UTC.
[Solar and geomagnetic data - last month (updated daily)]
[Solar wind and electron fluence charts (updated daily)]
[Solar cycles 21-23 (last update April 2, 2004)]
[Solar cycles 1-20]
[Graphical comparison of cycles 21, 22 and 23 (last update April 2, 2004)]
[Graphical comparison of cycles 2, 10, 13, 17, 20 and 23 (last update April 2, 2004)]
[Historical solar and geomagnetic data charts 1954-2003 (last update January 16,
2004)]
[Archived reports (last update April 5, 2004)]
The geomagnetic field was quiet to unsettled on April 15. Solar wind speed ranged between 336 and 421 km/sec. Wind speed increased slowly after 09h UTC as a weak "high" speed stream from coronal hole CH89 began to dominate the solar wind.
Solar flux measured at 20h UTC on 2.8 GHz was 96.7. The planetary A
index was 6 (STAR Ap - based on the mean of three hour interval ap indices: 7.1).
Three hour interval K indices: 11112223 (planetary), 11121223 (Boulder).
The background x-ray flux is at the class B1 level.
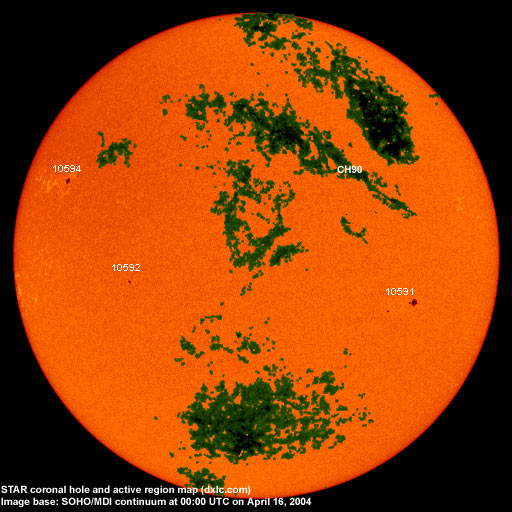
At midnight there were 3 spotted regions on the visible disk. The solar flare activity level was moderate. A single M class event was recorded during the day.
Region 10591 decayed fairly quickly, however, there is still a weak magnetic delta structure in the western part of the
leading penumbra. Flare: impulsive M1.2 at 16:44 UTC.
Region 10592 developed slowly and quietly.
Region 10594 was quiet and stable.
April 13-15: No fully or partly Earth directed CME observed. CMEs originating from a few days behind the northeast limb indicate that an interesting region could rotate into view in 3-4 days' time.
Coronal hole history (since late October 2002)
Compare today's report with the situation one solar rotation ago: 28
days ago 27 days ago 26 days ago
A very small coronal hole (CH89) in the southern hemisphere was in a possibly geoeffective position on April 12 and could cause a weak geomagnetic disturbance on April 15. A poorly defined coronal hole (CH90) in the northern hemisphere may have been in a geoeffective position on April 13-14.

Processed SOHO/EIT 284 image at 19:05 UTC on April 15. The darkest areas on the solar disk are likely coronal holes.
The geomagnetic field is expected to be quiet to unsettled on April 16-18 with a chance of a few active intervals on April 16 and 17 due to a weak high speed stream from coronal hole CH90.
Long distance low and medium frequency (below 2 MHz) propagation along east-west paths over high and upper middle latitudes is fair. Propagation along long distance north-south paths is poor. [Trans Atlantic propagation conditions are currently monitored every night on 1470 kHz. Dominant station tonight: Radio Vibraci�n (Venezuela), occasionally with CPN Radio (Per�) and WLAM Lewiston Me interfering. Several stations from the US northeast and from Newfoundland had fairly good signals].
| Coronal holes (1) | Coronal mass ejections (2) | M and X class flares (3) |
1) Effects from a coronal hole could reach Earth within the next 5 days. When the high speed stream has arrived
the color changes to green.
2) Material from a CME is likely to impact Earth within 96 hours.
3) There is a possibility of either M or X class flares within the next 48 hours.
Green: 0-20% probability, Yellow: 20-60% probability, Red: 60-100% probability.
Compare to the previous day's image.
Data for all numbered solar regions according to the Solar Region Summary provided by NOAA/SEC. Comments are my own, as is the STAR spot count (spots observed at or inside a few hours before midnight) and data for regions not numbered by SEC or where SEC has observed no spots. SEC active region numbers in the table below and in the active region map above are the historic SEC/USAF numbers.
| Active region | Date numbered | SEC spot count |
STAR spot count |
Location at midnight | Area | Classification | Comment |
|---|---|---|---|---|---|---|---|
| 10589 | 2004.04.05 | N11W75 | plage | ||||
| 10591 | 2004.04.12 | 14 | 6 | S16W38 | 0090 | DSO | beta-gamma-delta |
| 10592 | 2004.04.13 | 3 | 4 | S12E33 | 0030 | HSX |
classification was CAO at midnight, reversed polarity |
| 10593 | 2004.04.14 | 1 | S20E30 | 0000 | AXX | spotless | |
| 10594 | 2004.04.14 | 2 | 1 | N15E56 | 0060 | HSX | |
| S385 | emerged on 2004.04.11 |
S17W82 | plage | ||||
| S388 | emerged on 2004.04.12 |
S07E16 | plage | ||||
| Total spot count: | 20 | 11 | |||||
| SSN: | 60 | 41 | |||||
| Month | Average solar flux at Earth |
International sunspot number | Smoothed sunspot number |
|---|---|---|---|
| 2000.04 | 184.2 | 125.5 | 120.8 cycle 23 sunspot max. |
| 2000.07 | 202.3 | 170.1 | 119.8 |
| 2001.12 | 235.1 | 132.2 | 114.6 (-0.9) |
| 2003.03 | 131.4 | 61.1 | 74.0 (-4.3) |
| 2003.04 | 126.4 | 60.0 | 70.1 (-3.9) |
| 2003.05 | 115.7 | 55.2 | 67.6 (-2.5) |
| 2003.06 | 129.3 | 77.4 | 65.0 (-2.6) |
| 2003.07 | 127.7 | 83.3 | 61.8 (-3.2) |
| 2003.08 | 122.1 | 72.7 | 60.0 (-1.8) |
| 2003.09 | 112.2 | 48.7 | 59.5 (-0.5) |
| 2003.10 | 151.7 | 65.5 | (58.0 predicted, -1.5) |
| 2003.11 | 140.8 | 67.3 | (55.9 predicted, -2.1) |
| 2003.12 | 114.9 | 46.5 | (53.3 predicted, -2.6) |
| 2004.01 | 114.1 | 37.2 | (49.1 predicted, -4.2) |
| 2004.02 | 107.0 | 46.0 | (44.5 predicted, -4.6) |
| 2004.03 | 112.0 | 48.9 | (41.7 predicted, -2.8) |
| 2004.04 | 98.8 (1) | 27.9 (2) | (39.6 predicted, -2.1) |
1) Running average based on the daily 20:00 UTC observed solar flux value at 2800 MHz.
2) Unofficial, accumulated value based on the Boulder (NOAA/SEC) sunspot number. The official international sunspot number is typically
30-50% less.
This report has been prepared by Jan Alvestad. It is based partly on my own observations and analysis, and partly on data from some of these solar data sources. All time references are to the UTC day. Comments and suggestions are always welcome.
| [DX-Listeners' Club] |