
Last major update issued on April 19, 2004 at 04:15 UTC.
[Solar and geomagnetic data - last month (updated daily)]
[Solar wind and electron fluence charts (updated daily)]
[Solar cycles 21-23 (last update April 2, 2004)]
[Solar cycles 1-20]
[Graphical comparison of cycles 21, 22 and 23 (last update April 2, 2004)]
[Graphical comparison of cycles 2, 10, 13, 17, 20 and 23 (last update April 2, 2004)]
[Historical solar and geomagnetic data charts 1954-2003 (last update January 16,
2004)]
[Archived reports (last update April 18, 2004)]
The geomagnetic field was quiet to active on April 18. Solar wind speed ranged between 326 and 405 km/sec.
Solar flux measured at 20h UTC on 2.8 GHz was 109.2. The planetary A
index was 11 (STAR Ap - based on the mean of three hour interval ap indices: 11.8).
Three hour interval K indices: 12423332 (planetary), 23423322 (Boulder).
The background x-ray flux is at the class B2 level.
At midnight there were 6 spotted regions on the visible disk. The solar flare activity level was very low. No C class events were recorded during the day.
Region 10592 was quiet and stable.
Region 10593 developed quickly and quietly. The positive and negative polarity areas are currently well separated.
Region 10594 decayed slowly and quietly.
New region 10596 rotated partly into view late on April 16 and was numbered by SEC two days later. The region developed
quickly on April 18 and has magnetic delta structures both in the leading and trailing penumbrae. A minor M class flare is
possible.
Spotted regions not numbered by NOAA/SEC:
[S391] This region emerged to the north of region 10595 late on April 16 and developed moderately quickly on April 17.
Further development was observed on April 18 and the region currently has a minor degree of mixed polarities. Location at
midnight: S05E39.
[S393] This region emerged in the northeast quadrant on April 18. Location at midnight: N07E06.
April 16-18: No fully or partly Earth directed CME observed.
Coronal hole history (since late October 2002)
Compare today's report with the situation one solar rotation ago: 28
days ago 27 days ago 26 days ago
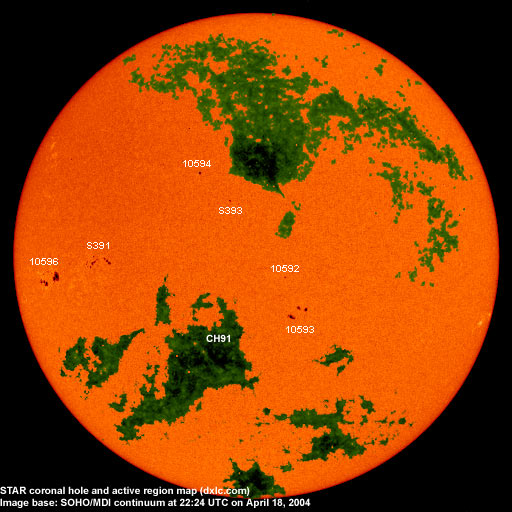
The northernmost extensions of a coronal hole (CH91) in the southern hemisphere will likely be in a geoeffective position on April 19-20.

Processed SOHO/EIT 284 image at 19:05 UTC on April 18. The darkest areas on the solar disk are likely coronal holes.
The geomagnetic field is expected to be quiet to unsettled on April 19-22.
Long distance low and medium frequency (below 2 MHz) propagation along east-west paths over high and upper middle latitudes is poor. Propagation along long distance north-south paths is fair. [Trans Atlantic propagation conditions are currently monitored every night on 1470 kHz. Dominant stations tonight: Radio Vibraci�n (Venezuela) early on, after 03h UTC CPN Radio (Per�) was very strong. Excellent signal even from Radio Santa Rosa (Lima, Per�) on 1499.93 kHz. A few of the most usual Newfoundland and northeastern USA stations were noted with mostly poor signals].
| Coronal holes (1) | Coronal mass ejections (2) | M and X class flares (3) |
1) Effects from a coronal hole could reach Earth within the next 5 days. When the high speed stream has arrived
the color changes to green.
2) Material from a CME is likely to impact Earth within 96 hours.
3) There is a possibility of either M or X class flares within the next 48 hours.
Green: 0-20% probability, Yellow: 20-60% probability, Red: 60-100% probability.
Compare to the previous day's image.
Data for all numbered solar regions according to the Solar Region Summary provided by NOAA/SEC. Comments are my own, as is the STAR spot count (spots observed at or inside a few hours before midnight) and data for regions not numbered by SEC or where SEC has observed no spots. SEC active region numbers in the table below and in the active region map above are the historic SEC/USAF numbers.
| Active region | Date numbered | SEC spot count |
STAR spot count |
Location at midnight | Area | Classification | Comment |
|---|---|---|---|---|---|---|---|
| 10591 | 2004.04.12 | 4 | S17W79 | 0050 | BXO | spotless | |
| 10592 | 2004.04.13 | 1 | 1 | S10W08 | 0010 | AXX |
classification was HRX at midnight |
| 10593 | 2004.04.14 | 7 | 13 | S18W11 | 0040 | BXO |
classification was DAO at midnight, area 0080 |
| 10594 | 2004.04.14 | 6 | 2 | N15E14 | 0020 | BXO |
classification was HSX at midnight |
| 10595 | 2004.04.16 | 6 | S08E40 | 0030 | ERO | spotless | |
| 10596 | 2004.04.18 | 8 | 25 | S08E60 | 0160 | DSO |
beta-gamma-delta formerly region S392 classification was DAC at midnight, area 0210 |
| S388 | emerged on 2004.04.12 |
S07W23 | plage | ||||
| S391 | emerged on 2004.04.16 |
23 | S05E39 | 0070 | DAI | beta-gamma | |
| S393 | emerged on 2004.04.18 |
2 | N07E06 | 0020 | HRX | ||
| Total spot count: | 32 | 66 | |||||
| SSN: | 92 | 126 | |||||
| Month | Average solar flux at Earth |
International sunspot number | Smoothed sunspot number |
|---|---|---|---|
| 2000.04 | 184.2 | 125.5 | 120.8 cycle 23 sunspot max. |
| 2000.07 | 202.3 | 170.1 | 119.8 |
| 2001.12 | 235.1 | 132.2 | 114.6 (-0.9) |
| 2003.03 | 131.4 | 61.1 | 74.0 (-4.3) |
| 2003.04 | 126.4 | 60.0 | 70.1 (-3.9) |
| 2003.05 | 115.7 | 55.2 | 67.6 (-2.5) |
| 2003.06 | 129.3 | 77.4 | 65.0 (-2.6) |
| 2003.07 | 127.7 | 83.3 | 61.8 (-3.2) |
| 2003.08 | 122.1 | 72.7 | 60.0 (-1.8) |
| 2003.09 | 112.2 | 48.7 | 59.5 (-0.5) |
| 2003.10 | 151.7 | 65.5 | (58.0 predicted, -1.5) |
| 2003.11 | 140.8 | 67.3 | (55.9 predicted, -2.1) |
| 2003.12 | 114.9 | 46.5 | (53.3 predicted, -2.6) |
| 2004.01 | 114.1 | 37.2 | (49.1 predicted, -4.2) |
| 2004.02 | 107.0 | 46.0 | (44.5 predicted, -4.6) |
| 2004.03 | 112.0 | 48.9 | (41.7 predicted, -2.8) |
| 2004.04 | 99.3 (1) | 34.5 (2) | (39.6 predicted, -2.1) |
1) Running average based on the daily 20:00 UTC observed solar flux value at 2800 MHz.
2) Unofficial, accumulated value based on the Boulder (NOAA/SEC) sunspot number. The official international sunspot number is typically
30-50% less.
This report has been prepared by Jan Alvestad. It is based partly on my own observations and analysis, and partly on data from some of these solar data sources. All time references are to the UTC day. Comments and suggestions are always welcome.
| [DX-Listeners' Club] |