
Last major update issued on April 22, 2004 at 04:00 UTC.
[Solar and geomagnetic data - last month (updated daily)]
[Solar wind and electron fluence charts (updated daily)]
[Solar cycles 21-23 (last update April 2, 2004)]
[Solar cycles 1-20]
[Graphical comparison of cycles 21, 22 and 23 (last update April 2, 2004)]
[Graphical comparison of cycles 2, 10, 13, 17, 20 and 23 (last update April 2, 2004)]
[Historical solar and geomagnetic data charts 1954-2003 (last update January 16,
2004)]
[Archived reports (last update April 18, 2004)]
The geomagnetic field was quiet to unsettled on April 21. Solar wind speed ranged between 364 and 446 km/sec under the influence of a weak coronal hole flow.
Solar flux measured at 20h UTC on 2.8 GHz was 112.7. The planetary A
index was 5 (STAR Ap - based on the mean of three hour interval ap indices: 6.5).
Three hour interval K indices: 13122221 (planetary), 23223132 (Boulder).
The background x-ray flux is at the class B2 level.
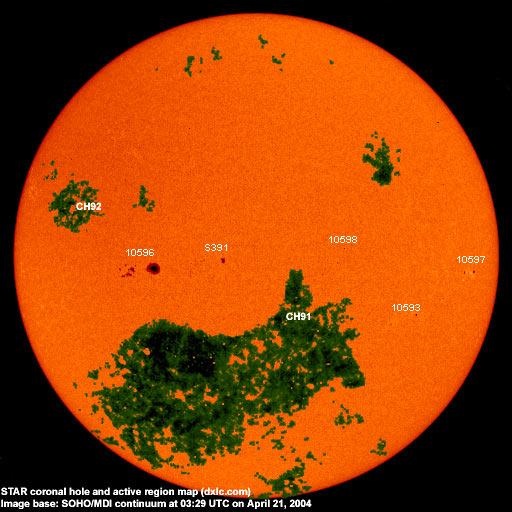
At midnight there were 5 spotted regions on the visible disk. The solar flare activity level was low. A total of 2 C class events was recorded during the day.
Region 10593 decayed slowly and quietly.
Region 10596 did not change significantly and remains capable of producing minor M class flares. Flares:
C2.1 at 02:58 and C1.8 at 16:15 UTC. This region was the source of an M1.2 flare at 02:19 UTC on April 22.
Region 10597 was quiet and stable, the region will rotate over the southwest limb late today.
New region 10598 emerged in the southwest quadrant on April 19 and was numbered by SEC two days later.
Spotted regions not numbered by NOAA/SEC:
[S391] This region emerged to the north of region 10595 late on April 16 and developed moderately quickly on April 17.
Further development was observed on April 18, while the region decayed slowly on April 19 and lost several small spots. The region
decayed further on April 20 and 21. Location at
midnight: S06W01.
April 19-21: No fully or partly Earth directed CME observed. A full halo CME observed on April 20 had a backsided origin.
Coronal hole history (since late October 2002)
Compare today's report with the situation one solar rotation ago: 28
days ago 27 days ago 26 days ago
The northernmost extensions of a coronal hole (CH91) in the southern hemisphere were in a geoeffective position on April 19-20. A recurrent coronal hole (CH92) in the northern hemisphere will probably rotate into a geoeffective position on April 23-24.

Processed SOHO/EIT 284 image at 01:05 UTC on April 22. The darkest areas on the solar disk are likely coronal holes.
The geomagnetic field is expected to be quiet to unsettled on April 22-23 due to a weak high speed stream from coronal hole CH91, occasional active intervals are possible. Quiet to unsettled is likely on April 24 becoming unsettled to minor storm on April 25 due to the arrival of a high speed stream from coronal hole CH92.
Long distance low and medium frequency (below 2 MHz) propagation along east-west paths over high and upper middle latitudes is fair. Propagation along long distance north-south paths is fair to poor. [Trans Atlantic propagation conditions are currently monitored every night on 1470 kHz. Dominant stations tonight: Radio Vibraci�n (Venezuela), CPN Radio (Per�) and Radio Cristal del Uruguay, all with fairly poor signals. A number of stations from the easternmost parts of the USA and Canada were noted on other frequencies, i.e. WTOP 1500, WWZN 1510, WWKB 1520 and so on].
| Coronal holes (1) | Coronal mass ejections (2) | M and X class flares (3) |
1) Effects from a coronal hole could reach Earth within the next 5 days. When the high speed stream has arrived
the color changes to green.
2) Material from a CME is likely to impact Earth within 96 hours.
3) There is a possibility of either M or X class flares within the next 48 hours.
Green: 0-20% probability, Yellow: 20-60% probability, Red: 60-100% probability.
Compare to the previous day's image.
Data for all numbered solar regions according to the Solar Region Summary provided by NOAA/SEC. Comments are my own, as is the STAR spot count (spots observed at or inside a few hours before midnight) and data for regions not numbered by SEC or where SEC has observed no spots. SEC active region numbers in the table below and in the active region map above are the historic SEC/USAF numbers.
| Active region | Date numbered | SEC spot count |
STAR spot count |
Location at midnight | Area | Classification | Comment |
|---|---|---|---|---|---|---|---|
| 10592 | 2004.04.13 | S10W47 | plage | ||||
| 10593 | 2004.04.14 | 5 | 1 | S18W51 | 0050 | CSO |
classification was HSX at midnight, area 0020, location S18W45 |
| 10594 | 2004.04.14 | N15W26 | plage | ||||
| 10595 | 2004.04.16 | 11 | S06E00 | 0050 | CAO |
spotless instead of numbering a new region, SEC has reused 10595. See S391 |
|
| 10596 | 2004.04.18 | 22 | 18 | S07E19 | 0340 | EAI |
beta-gamma-delta classification was EKI at midnight, area 0400 |
| 10597 | 2004.04.20 | 4 | 3 | S06W72 | 0050 | DSO | |
| 10598 | 2004.04.21 | 6 | 4 | S05W30 | 0020 | CSO |
formerly region S394 location was S06W31 at midnight |
| S388 | emerged on 2004.04.12 |
S07W62 | plage | ||||
| S391 | emerged on 2004.04.16 |
7 | S06W01 | 0050 | CAO | ||
| S393 | emerged on 2004.04.18 |
N07W33 | plage | ||||
| Total spot count: | 48 | 33 | |||||
| SSN: | 98 | 83 | |||||
| Month | Average solar flux at Earth |
International sunspot number | Smoothed sunspot number |
|---|---|---|---|
| 2000.04 | 184.2 | 125.5 | 120.8 cycle 23 sunspot max. |
| 2000.07 | 202.3 | 170.1 | 119.8 |
| 2001.12 | 235.1 | 132.2 | 114.6 (-0.9) |
| 2003.03 | 131.4 | 61.1 | 74.0 (-4.3) |
| 2003.04 | 126.4 | 60.0 | 70.1 (-3.9) |
| 2003.05 | 115.7 | 55.2 | 67.6 (-2.5) |
| 2003.06 | 129.3 | 77.4 | 65.0 (-2.6) |
| 2003.07 | 127.7 | 83.3 | 61.8 (-3.2) |
| 2003.08 | 122.1 | 72.7 | 60.0 (-1.8) |
| 2003.09 | 112.2 | 48.7 | 59.5 (-0.5) |
| 2003.10 | 151.7 | 65.5 | (58.0 predicted, -1.5) |
| 2003.11 | 140.8 | 67.3 | (55.9 predicted, -2.1) |
| 2003.12 | 114.9 | 46.5 | (53.3 predicted, -2.6) |
| 2004.01 | 114.1 | 37.2 | (49.1 predicted, -4.2) |
| 2004.02 | 107.0 | 46.0 | (44.5 predicted, -4.6) |
| 2004.03 | 112.0 | 48.9 | (41.7 predicted, -2.8) |
| 2004.04 | 101.1 (1) | 44.6 (2) | (39.6 predicted, -2.1) |
1) Running average based on the daily 20:00 UTC observed solar flux value at 2800 MHz.
2) Unofficial, accumulated value based on the Boulder (NOAA/SEC) sunspot number. The official international sunspot number is typically
30-50% less.
This report has been prepared by Jan Alvestad. It is based partly on my own observations and analysis, and partly on data from some of these solar data sources. All time references are to the UTC day. Comments and suggestions are always welcome.
| [DX-Listeners' Club] |