
Last major update issued on April 29, 2004 at 04:05 UTC.
[Solar and geomagnetic data - last month (updated daily)]
[Solar wind and electron fluence charts (updated daily)]
[Solar cycles 21-23 (last update April 2, 2004)]
[Solar cycles 1-20]
[Graphical comparison of cycles 21, 22 and 23 (last update April 2, 2004)]
[Graphical comparison of cycles 2, 10, 13, 17, 20 and 23 (last update April 2, 2004)]
[Historical solar and geomagnetic data charts 1954-2004 (last update April 28,
2004)]
[Archived reports (last update April 18, 2004)]
The geomagnetic field was quiet to active on April 28. Solar wind speed ranged between 408 and 615 km/sec. A high speed stream from the eastern part of coronal hole CH92 arrived after 05h UTC.
Solar flux measured at 20h UTC on 2.8 GHz was 89.5. The planetary A
index was 8 (STAR Ap - based on the mean of three hour interval ap indices: 9.3).
Three hour interval K indices: 10212342 (planetary), 10213433 (Boulder).
The background x-ray flux is at the class A6 level.
At midnight there were 2 spotted regions on the visible disk. The solar flare activity level was very low. No C class events were recorded during the day.
Region 10596 decayed slowly and quietly and is rotating over the southwest limb.
Region 10599 decayed slowly and quietly.
April 26-28: No fully or partly Earth directed CME observed due to no new LASCO images.
April 27: The C3.1 event in region 10599 at 07:23 UTC was, as observed in GOES SXI images, associated with a CME. This CME
is likely to have been earth directed and could reach our planet late on April 29 or early on April 30.
Coronal hole history (since late October 2002)
Compare today's report with the situation one solar rotation ago: 28
days ago 27 days ago 26 days ago
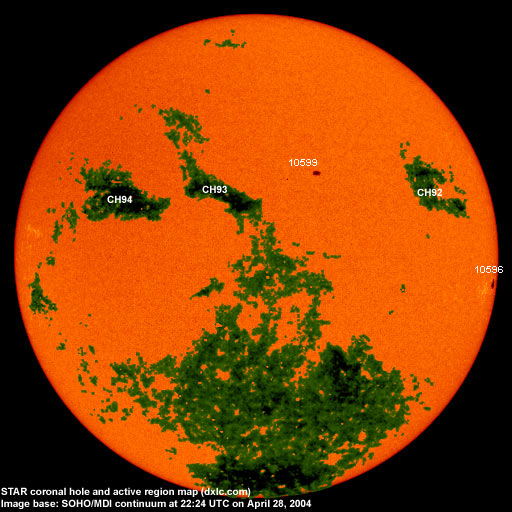
A recurrent coronal hole (CH92) in the northern hemisphere was in a geoeffective position on April 23-25. A recurrent coronal hole (CH93) in the northern hemisphere will likely be in a geoeffective position on April 29-30 while the eastern part (CH94) of what was CH88 during the previous rotation will be in a geoeffective position on May 1.
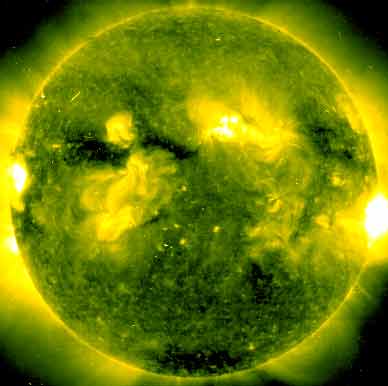
Processed SOHO/EIT 284 image at 19:05 UTC on April 28. The darkest areas on the solar disk are likely coronal holes.
The geomagnetic field is expected to be mostly quiet on April 29. A CME impact is possible late on April 29 or early on April 30 and could cause unsettled to active conditions on April 30. A high speed stream from coronal hole CH93 could arrive on May 2 and cause quiet to active conditions.
Long distance low and medium frequency (below 2 MHz) propagation along east-west paths over high and upper middle latitudes is fair. Propagation along long distance north-south paths is fair. [Trans Atlantic propagation conditions are currently monitored every night on 1470 kHz. Dominant station tonight: CPN Radio (Per�). This station had a huge signal during the last hour prior to local sunrise. Stations from Per� were noted on other frequencies as well, Radio Santa Rosa on 1500 and La Peruanisima on 1590 kHz had fairly good signals, unidentified stations noted on 1250 and 1390 kHz. Prior to 03h UTC lots of stations from the eastern parts of the USA and Canada could be heard throughout the MW band].
| Coronal holes (1) | Coronal mass ejections (2) | M and X class flares (3) |
1) Effects from a coronal hole could reach Earth within the next 5 days. When the high speed stream has arrived
the color changes to green.
2) Material from a CME is likely to impact Earth within 96 hours.
3) There is a possibility of either M or X class flares within the next 48 hours.
Green: 0-20% probability, Yellow: 20-60% probability, Red: 60-100% probability.
Compare to the previous day's image.
Data for all numbered solar regions according to the Solar Region Summary provided by NOAA/SEC. Comments are my own, as is the STAR spot count (spots observed at or inside a few hours before midnight) and data for regions not numbered by SEC or where SEC has observed no spots. SEC active region numbers in the table below and in the active region map above are the historic SEC/USAF numbers.
| Active region | Date numbered | SEC spot count |
STAR spot count |
Location at midnight | Area | Classification | Comment |
|---|---|---|---|---|---|---|---|
| 10596 | 2004.04.18 | 2 | 2 | S08W79 | 0200 | DSO |
classification was HAX at midnight, area 0120 |
| 10599 | 2004.04.24 | 10 | 5 | N15W11 | 0090 | CAO | |
| 10600 | 2004.04.26 | N18W32 | plage | ||||
| Total spot count: | 12 | 7 | |||||
| SSN: | 32 | 27 | |||||
| Month | Average solar flux at Earth |
International sunspot number | Smoothed sunspot number |
|---|---|---|---|
| 2000.04 | 184.2 | 125.5 | 120.8 cycle 23 sunspot max. |
| 2000.07 | 202.3 | 170.1 | 119.8 |
| 2001.12 | 235.1 | 132.2 | 114.6 (-0.9) |
| 2003.03 | 131.4 | 61.1 | 74.0 (-4.3) |
| 2003.04 | 126.4 | 60.0 | 70.1 (-3.9) |
| 2003.05 | 115.7 | 55.2 | 67.6 (-2.5) |
| 2003.06 | 129.3 | 77.4 | 65.0 (-2.6) |
| 2003.07 | 127.7 | 83.3 | 61.8 (-3.2) |
| 2003.08 | 122.1 | 72.7 | 60.0 (-1.8) |
| 2003.09 | 112.2 | 48.7 | 59.5 (-0.5) |
| 2003.10 | 151.7 | 65.5 | (58.0 predicted, -1.5) |
| 2003.11 | 140.8 | 67.3 | (55.9 predicted, -2.1) |
| 2003.12 | 114.9 | 46.5 | (53.3 predicted, -2.6) |
| 2004.01 | 114.1 | 37.2 | (49.1 predicted, -4.2) |
| 2004.02 | 107.0 | 46.0 | (44.5 predicted, -4.6) |
| 2004.03 | 112.0 | 48.9 | (41.7 predicted, -2.8) |
| 2004.04 | 102.1 (1) | 56.9 (2) | (39.6 predicted, -2.1) |
1) Running average based on the daily 20:00 UTC observed solar flux value at 2800 MHz.
2) Unofficial, accumulated value based on the Boulder (NOAA/SEC) sunspot number. The official international sunspot number is typically
30-50% less.
This report has been prepared by Jan Alvestad. It is based partly on my own observations and analysis, and partly on data from some of these solar data sources. All time references are to the UTC day. Comments and suggestions are always welcome.
| [DX-Listeners' Club] |