
Last major update issued on August 16, 2004 at 03:40 UTC.
[Solar and geomagnetic data - last month (updated daily)]
[Solar wind and electron fluence charts (updated daily)]
[Solar cycles 21-23 (last update August 2, 2004)]
[Solar cycles 1-20]
[Graphical comparison of cycles 21, 22 and 23 (last update August 2, 2004)]
[Graphical comparison of cycles 2, 10, 13, 17, 20 and 23 (last update August 2, 2004)]
[Historical solar and geomagnetic data charts 1954-2004 (last update April 28,
2004)]
[Archived reports (last update August 10, 2004)]
The geomagnetic field was quiet to unsettled on August 15. Solar wind speed ranged between 335 and 428 km/sec.
Solar flux measured at 20h UTC on 2.8 GHz was 138.8. The planetary A
index was 7 (STAR Ap - based on the mean of three hour interval ap indices: 7.5).
Three hour interval K indices: 21123322 (planetary), 20102311 (Boulder).
The background x-ray flux is at the class B7 level.
At midnight there were 3 spotted regions on the visible disk. The solar flare activity level was high. A total of 8 C and 5 M class events was recorded during the day.
Region 10656 decayed, particularly in the central section. Further major flares are possible as there is still at
least one magnetic delta structure. Flares: C3.8 at 01:30, C6.9 at 03:33, M1.2 at 05:06, M1.2
at 06:00, M2.6/2F at 11:32, very impulsive M9.4/1N at 12:41, C1.7 at 14:24, C2.9 at 16:50, C1.4 at 17:21, C1.6 at 18:03, M1.2 at
18:45, C4.9 at 20:46, C2.1 at 23:00 UTC.
Region 10660 decayed slowly and quietly.
Region 10661 lost the small trailing spots gained one day earlier.
August 13-15: Several small CMEs were observed over the south pole, the southwest limb and the central west limb after flare activity in region 10656. While none of these CMEs had any obvious Earth directed components, there is a chance that some of the ejected material could reach Earth.
Coronal hole history (since late October 2002)
Compare today's report with the situation one solar rotation ago: 28
days ago 27 days ago 26 days ago
No obvious coronal holes are currently approaching geoeffective positions.
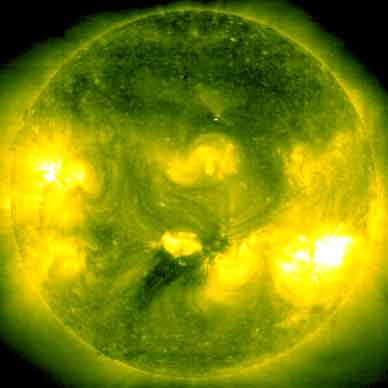
Processed SOHO/EIT 284 image at 19:06 UTC on August 15. The darkest areas on the solar disk are likely coronal holes.
The geomagnetic field is expected to be quiet to unsettled on August 16-18. There is a chance of some effects from recent CMEs associated with flare activity in region 10656 on August 16 and 17.
| Coronal holes (1) | Coronal mass ejections (2) | M and X class flares (3) |
1) Effects from a coronal hole could reach Earth within the next 5 days. When the high speed stream has arrived
the color changes to green.
2) Material from a CME is likely to impact Earth within 96 hours.
3) There is a possibility of either M or X class flares within the next 48 hours.
Green: 0-20% probability, Yellow: 20-60% probability, Red: 60-100% probability.
Long distance low and medium frequency (below 2 MHz) propagation along east-west paths over high and upper middle latitudes is fair. Propagation along long distance north-south paths is poor to fair. Trans Atlantic propagation conditions are monitored every night on 1470 kHz. Dominant stations tonight: Radio Rafaela (Argentina) and Radio Vibraci�n (Venezuela). Propagation was best towards Venezuela and the eastern Caribbean with stations heard on many frequencies. Several stations from North America could be heard as well with WWZN having the best signal (as usual).
Compare to the previous day's image.
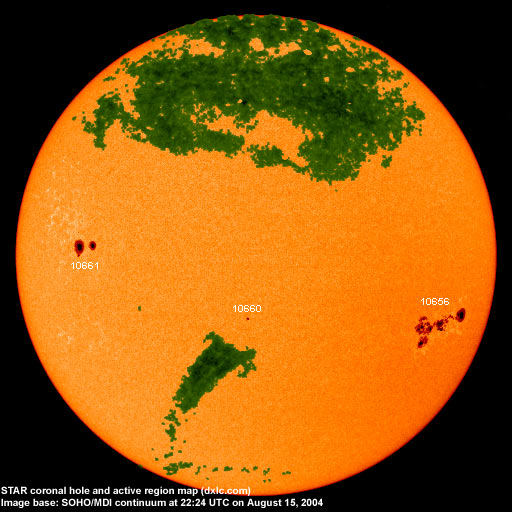
Data for all numbered solar regions according to the Solar Region Summary provided by NOAA/SEC. Comments are my own, as is the STAR spot count (spots observed at or inside a few hours before midnight) and data for regions not numbered by SEC or where SEC has observed no spots. SEC active region numbers in the table below and in the active region map above are the historic SEC/USAF numbers.
| Active region | Date numbered | SEC spot count |
STAR spot count |
Location at midnight | Area | Classification | Comment |
|---|---|---|---|---|---|---|---|
| 10656 | 2004.08.06 | 54 | 63 | S13W48 | 1310 | FHC |
beta-gamma-delta area was 1100 at midnight |
| 10657 | 2004.08.06 | 1 | N10W41 | 0020 | HSX | spotless | |
| 10658 | 2004.08.07 | S05W53 | plage | ||||
| 10659 | 2004.08.10 | N18W06 | plage | ||||
| 10660 | 2004.08.11 | 1 | 1 | S07E04 | 0010 | HSX | |
| 10661 | 2004.08.12 | 2 | 3 | N07E47 | 0390 | DKO | |
| S444 | emerged on 2004.08.09 |
S10W19 | plage | ||||
| Total spot count: | 58 | 67 | |||||
| SSN: | 98 | 97 | |||||
| Month | Average solar flux at Earth |
International sunspot number | Smoothed sunspot number |
|---|---|---|---|
| 2000.04 | 184.2 | 125.5 | 120.8 cycle 23 sunspot max. |
| 2000.07 | 202.3 | 170.1 | 119.8 |
| 2001.12 | 235.1 | 132.2 | 114.6 (-0.9) |
| 2003.06 | 129.3 | 77.4 | 65.0 (-2.6) |
| 2003.07 | 127.7 | 83.3 | 61.8 (-3.2) |
| 2003.08 | 122.1 | 72.7 | 60.1 (-1.7) |
| 2003.09 | 112.2 | 48.7 | 59.6 (-0.5) |
| 2003.10 | 151.7 | 65.5 | 58.2 (-1.4) |
| 2003.11 | 140.8 | 67.3 | 56.8 (-1.4) |
| 2003.12 | 114.9 | 46.5 | 54.8 (-2.0) |
| 2004.01 | 114.1 | 37.7 | 52.0 (-2.8) |
| 2004.02 | 107.0 | 45.8 | (49.1 predicted, -2.9) |
| 2004.03 | 112.0 | 49.1 | (46.5 predicted, -2.6) |
| 2004.04 | 101.2 | 39.3 | (44.3 predicted, -2.2) |
| 2004.05 | 99.8 | 41.5 | (41.0 predicted, -3.3) |
| 2004.06 | 97.4 | 43.2 | (38.2 predicted, -2.8) |
| 2004.07 | 119.1 | 51.0 | (36.3 predicted, -1.9) |
| 2004.08 | 111.3 (1) | 40.2 (2) | (34.9 predicted, -1.4) |
1) Running average based on the daily 20:00 UTC observed solar flux value at 2800 MHz.
2) Unofficial, accumulated value based on the Boulder (NOAA/SEC) sunspot number. The official international sunspot number is typically
30-50% less.
This report has been prepared by Jan Alvestad. It is based partly on my own observations and analysis, and partly on data from some of these solar data sources. All time references are to the UTC day. Comments and suggestions are always welcome.
| [DX-Listeners' Club] |