
Last major update issued on August 19, 2004 at 04:10 UTC.
[Solar and geomagnetic data - last month (updated daily)]
[Solar wind and electron fluence charts (updated daily)]
[Solar cycles 21-23 (last update August 2, 2004)]
[Solar cycles 1-20]
[Graphical comparison of cycles 21, 22 and 23 (last update August 2, 2004)]
[Graphical comparison of cycles 2, 10, 13, 17, 20 and 23 (last update August 2, 2004)]
[Historical solar and geomagnetic data charts 1954-2004 (last update April 28,
2004)]
[Archived reports (last update August 10, 2004)]
The geomagnetic field was quiet to unsettled on August 18. Solar wind speed ranged between 315 and 364 km/sec.
Solar flux measured at 17h UTC on 2.8 GHz was 128.3 (the measurement at 20h UTC was influenced by an X flare). The planetary A
index was 13 (STAR Ap - based on the mean of three hour interval ap indices: 13.6).
Three hour interval K indices: 32333333 (planetary), 32312323 (Boulder).
The background x-ray flux is at the class C1 level.
At midnight there were 3 spotted regions on the visible disk. The solar flare activity level was high. A total of 18 C and 1 X class events was recorded during the day.
Region 10656 rotated out of view at the southwest limb and was very active during the day. Another major flare is possible today
while the region is just behind the limb. Flares: C6.1 at 01:10, C3.3 at 02:23, C1.8 at 02:42,
C2.5 at 03:19, C1.6 at 04:17, C3.0 at 05:10, C4.1 at 07:26, C4.8 at 08:27, C6.5 at 08:45, C1.4 at 13:15, C4.0 at 13:56, C2.2 at
14:44, C7.2 at 16:46, major X1.8 (with associated weak type IV and moderate type II radio sweeps) at 17:40, C8.0 at 18:46
and C2.3 at 22:58 UTC.
Region 10661 gained a few small spots and was otherwise mostly unchanged. Flare:
C3.2 at 10:44 UTC.
New region 10662 emerged in the northeast quadrant on August 17 and was numbered by SEC the next day. The region developed
slowly and has mixed polarities.
Spotted regions not numbered by NOAA/SEC:
[S446] This region rotated partly into view at the northeast limb late on August 18. Location at midnight: N10E85.
August 16: A full halo CME was observed beginning at 15:18 UTC in LASCO C3 images. The source of this event was likely a few
days behind the west limb.
August 17: A full halo CME was observed in LASCO C3 images starting at 07:42 UTC. Most of the ejected material was observed
over the southeast limb, faint extensions were noted at the west limbs. The source of this CME was a fairly large filament
eruption to the south and southeast of region 10661. This eruption began around 04h UTC and peaked near 06h UTC.
August 18: A CME was observed after the X1 flare in the afternoon. Most of the ejected material was observed over the
southwest limb, however, there were nearly simultaneous emissions over the east limb, and there is a slight chance that this was a
(faint) full halo CME.
Coronal hole history (since late October 2002)
Compare today's report with the situation one solar rotation ago: 28
days ago 27 days ago 26 days ago
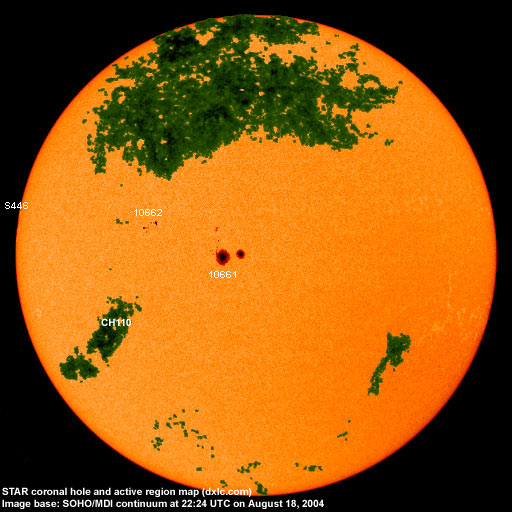
A coronal hole (CH110) in the southern hemisphere will likely rotate to a geoeffective position on August 22.
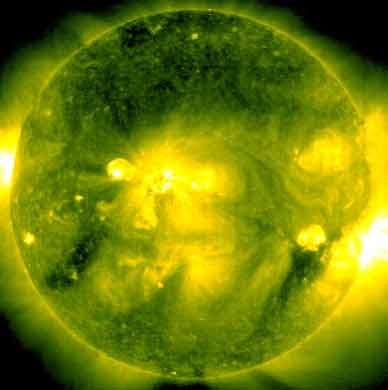
Processed SOHO/EIT 284 image at 01:06 UTC on August 19. The darkest areas on the solar disk are likely coronal holes.
The geomagnetic field is expected to be quiet to unsettled most of August 19. Late on August 19 or early on August 20 there is a possibility of a CME impact with unsettled to minor storm conditions.
| Coronal holes (1) | Coronal mass ejections (2) | M and X class flares (3) |
1) Effects from a coronal hole could reach Earth within the next 5 days. When the high speed stream has arrived
the color changes to green.
2) Material from a CME is likely to impact Earth within 96 hours.
3) There is a possibility of either M or X class flares within the next 48 hours.
Green: 0-20% probability, Yellow: 20-60% probability, Red: 60-100% probability.
Long distance low and medium frequency (below 2 MHz) propagation along east-west paths over high and upper middle latitudes is poor. Propagation along long distance north-south paths is poor to very poor. Trans Atlantic propagation conditions are monitored every night on 1470 kHz. Dominant stations tonight: unidentified station as thunderstorms in the southern North Sea made listening difficult.
Compare to the previous day's image.
Data for all numbered solar regions according to the Solar Region Summary provided by NOAA/SEC. Comments are my own, as is the STAR spot count (spots observed at or inside a few hours before midnight) and data for regions not numbered by SEC or where SEC has observed no spots. SEC active region numbers in the table below and in the active region map above are the historic SEC/USAF numbers.
| Active region | Date numbered | SEC spot count |
STAR spot count |
Location at midnight | Area | Classification | Comment |
|---|---|---|---|---|---|---|---|
| 10656 | 2004.08.06 | 7 | S14W91 | 0190 | EAO | rotated out of view | |
| 10657 | 2004.08.06 | N10W80 | plage | ||||
| 10659 | 2004.08.10 | N18W45 | plage | ||||
| 10660 | 2004.08.11 | S08W37 | plage | ||||
| 10661 | 2004.08.12 | 13 | 19 | N10E07 | 0540 | DKO | beta-gamma |
| 10662 | 2004.08.18 | 3 | 16 | N12E28 | 0020 | CRO |
beta-gamma formerly region S445 classification was DAI at midnight, area 0050 |
| S444 | emerged on 2004.08.09 |
S10W71 | plage | ||||
| S446 | visible on 2004.08.18 |
1 | N10E85 | 0150 | HAX | ||
| Total spot count: | 23 | 36 | |||||
| SSN: | 53 | 66 | |||||
| Month | Average solar flux at Earth |
International sunspot number | Smoothed sunspot number |
|---|---|---|---|
| 2000.04 | 184.2 | 125.5 | 120.8 cycle 23 sunspot max. |
| 2000.07 | 202.3 | 170.1 | 119.8 |
| 2001.12 | 235.1 | 132.2 | 114.6 (-0.9) |
| 2003.06 | 129.3 | 77.4 | 65.0 (-2.6) |
| 2003.07 | 127.7 | 83.3 | 61.8 (-3.2) |
| 2003.08 | 122.1 | 72.7 | 60.1 (-1.7) |
| 2003.09 | 112.2 | 48.7 | 59.6 (-0.5) |
| 2003.10 | 151.7 | 65.5 | 58.2 (-1.4) |
| 2003.11 | 140.8 | 67.3 | 56.8 (-1.4) |
| 2003.12 | 114.9 | 46.5 | 54.8 (-2.0) |
| 2004.01 | 114.1 | 37.7 | 52.0 (-2.8) |
| 2004.02 | 107.0 | 45.8 | (49.1 predicted, -2.9) |
| 2004.03 | 112.0 | 49.1 | (46.5 predicted, -2.6) |
| 2004.04 | 101.2 | 39.3 | (44.3 predicted, -2.2) |
| 2004.05 | 99.8 | 41.5 | (41.0 predicted, -3.3) |
| 2004.06 | 97.4 | 43.2 | (38.2 predicted, -2.8) |
| 2004.07 | 119.1 | 51.0 | (36.3 predicted, -1.9) |
| 2004.08 | 114.8 (1) | 46.2 (2) | (34.9 predicted, -1.4) |
1) Running average based on the daily 20:00 UTC observed solar flux value at 2800 MHz.
2) Unofficial, accumulated value based on the Boulder (NOAA/SEC) sunspot number. The official international sunspot number is typically
30-50% less.
This report has been prepared by Jan Alvestad. It is based partly on my own observations and analysis, and partly on data from some of these solar data sources. All time references are to the UTC day. Comments and suggestions are always welcome.
| [DX-Listeners' Club] |