
Last major update issued on August 27, 2004 at 03:40 UTC. Minor update posted at 04:45 UTC.
[Solar and geomagnetic data - last month (updated daily)]
[Solar wind and electron fluence charts (updated daily)]
[Solar cycles 21-23 (last update August 2, 2004)]
[Solar cycles 1-20]
[Graphical comparison of cycles 21, 22 and 23 (last update August 2, 2004)]
[Graphical comparison of cycles 2, 10, 13, 17, 20 and 23 (last update August 2, 2004)]
[Historical solar and geomagnetic data charts 1954-2004 (last update April 28,
2004)]
[Archived reports (last update August 25, 2004)]
The geomagnetic field was quiet to unsettled on August 26. Solar wind speed ranged between 318 and 518 km/sec. Another weak disturbance began near noon as a coronal hole flow (unidentified source) reached Earth.
Solar flux measured at 20h UTC on 2.8 GHz was 97.5. The planetary A
index was 7 (STAR Ap - based on the mean of three hour interval ap indices: 7.9).
Three hour interval K indices: 21112333 (planetary), 21113332 (Boulder).
The background x-ray flux is at the class B1 level.
At midnight there were 2 spotted regions on the visible disk. The solar flare activity level was low. A single C class event was recorded during the day.
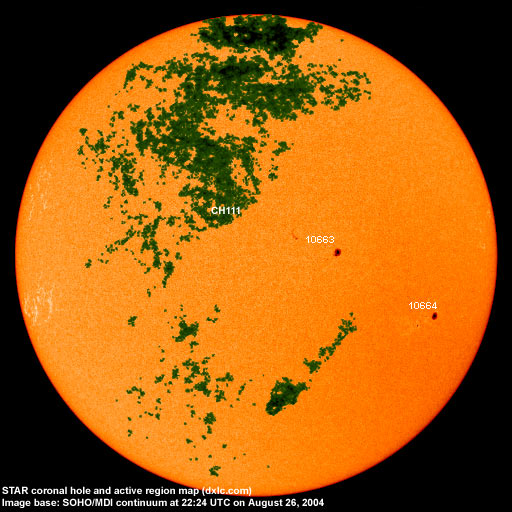
Region 10663 developed further in the trailing spot section while slow decay was observed in the leading penumbra. Flare:
C1.8 at 02:19 UTC.
Region 10664 decayed slowly and quietly.
August 24-26: No obviously Earth directed CMEs were observed.
Coronal hole history (since late October 2002)
Compare today's report with the situation one solar rotation ago: 28
days ago 27 days ago 26 days ago
A poorly defined coronal hole (CH111) in the northern hemisphere could rotate into a geoeffective position on August 28-29.
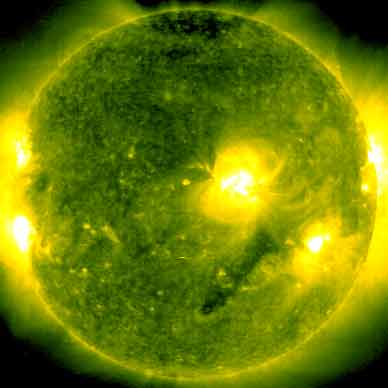
Processed SOHO/EIT 284 image at 19:06 UTC on August 26. The darkest areas on the solar disk are likely coronal holes.
The geomagnetic field is expected to be mostly quiet on August 27-30. A weak coronal hole related disturbance could reach Earth on August 31 and September 1 and cause unsettled to active intervals.
| Coronal holes (1) | Coronal mass ejections (2) | M and X class flares (3) |
1) Effects from a coronal hole could reach Earth within the next 5 days. When the high speed stream has arrived
the color changes to green.
2) Material from a CME is likely to impact Earth within 96 hours.
3) There is a possibility of either M or X class flares within the next 48 hours.
Green: 0-20% probability, Yellow: 20-60% probability, Red: 60-100% probability.
Long distance low and medium frequency (below 2 MHz) propagation along east-west paths over high and upper middle latitudes is fair to occasionally poor. Propagation along long distance north-south paths is poor to occasionally fair. Trans Atlantic propagation conditions are monitored every night on 1470 kHz. Dominant stations tonight: Radio Cristal del Uruguay and Radio Vibraci�n (Venezuela). Propagation covered a fairly large area with the Brazilian R�dio Globo noted on 1590 kHz at the same time as several stations from North America did well on other frequencies. Stations from North America were noted on most frequencies above 1600 kHz, otherwise the most consistent signals were from CJYQ on 930 and WTOP on 1500 kHz. Greenland on 570.05 kHz had an even better signal today compared to yesterday.
Comment added at 04:45 UTC on August 27: Local sunrise propagation was amazing with ZNS Network (1540 kHz, Bahamas) observed with a signal reaching S9+15dB in peaks. WDHP on 1620 had an unusually strong signal as well.
Compare to the previous day's image.
Data for all numbered solar regions according to the Solar Region Summary provided by NOAA/SEC. Comments are my own, as is the STAR spot count (spots observed at or inside a few hours before midnight) and data for regions not numbered by SEC or where SEC has observed no spots. SEC active region numbers in the table below and in the active region map above are the historic SEC/USAF numbers.
| Active region | Date numbered | SEC spot count |
STAR spot count |
Location at midnight | Area | Classification | Comment |
|---|---|---|---|---|---|---|---|
| 10662 | 2004.08.18 | N14W80 | plage | ||||
| 10663 | 2004.08.19 | 16 | 13 | N10W14 | 0120 | CAO | |
| 10664 | 2004.08.20 | 8 | 7 | S11W42 | 0120 | DAO |
classification was CAO at midnight, area 0100 |
| 10665 | 2004.08.22 | N05W67 | plage | ||||
| S448 | emerged on 2004.08.22 |
N09W71 | plage | ||||
| Total spot count: | 24 | 20 | |||||
| SSN: | 44 | 40 | |||||
| Month | Average solar flux at Earth |
International sunspot number | Smoothed sunspot number |
|---|---|---|---|
| 2000.04 | 184.2 | 125.5 | 120.8 cycle 23 sunspot max. |
| 2000.07 | 202.3 | 170.1 | 119.8 |
| 2001.12 | 235.1 | 132.2 | 114.6 (-0.9) |
| 2003.06 | 129.3 | 77.4 | 65.0 (-2.6) |
| 2003.07 | 127.7 | 83.3 | 61.8 (-3.2) |
| 2003.08 | 122.1 | 72.7 | 60.1 (-1.7) |
| 2003.09 | 112.2 | 48.7 | 59.6 (-0.5) |
| 2003.10 | 151.7 | 65.5 | 58.2 (-1.4) |
| 2003.11 | 140.8 | 67.3 | 56.8 (-1.4) |
| 2003.12 | 114.9 | 46.5 | 54.8 (-2.0) |
| 2004.01 | 114.1 | 37.7 | 52.0 (-2.8) |
| 2004.02 | 107.0 | 45.8 | (49.1 predicted, -2.9) |
| 2004.03 | 112.0 | 49.1 | (46.5 predicted, -2.6) |
| 2004.04 | 101.2 | 39.3 | (44.3 predicted, -2.2) |
| 2004.05 | 99.8 | 41.5 | (41.0 predicted, -3.3) |
| 2004.06 | 97.4 | 43.2 | (38.2 predicted, -2.8) |
| 2004.07 | 119.1 | 51.0 | (36.3 predicted, -1.9) |
| 2004.08 | 113.7 (1) | 65.1 (2) | (34.9 predicted, -1.4) |
1) Running average based on the daily 20:00 UTC observed solar flux value at 2800 MHz.
2) Unofficial, accumulated value based on the Boulder (NOAA/SEC) sunspot number. The official international sunspot number is typically
30-50% less.
This report has been prepared by Jan Alvestad. It is based partly on my own observations and analysis, and partly on data from some of these solar data sources. All time references are to the UTC day. Comments and suggestions are always welcome.
| [DX-Listeners' Club] |