
Last major update issued on December 27, 2004 at 03:25 UTC.
[Solar and geomagnetic data - last month (updated daily)]
[Solar wind and electron fluence charts (updated daily)]
[Solar cycles 21-23 (last update December 3, 2004)]
[Solar cycles 1-20]
[Graphical comparison of cycles 21, 22 and 23 (last update December 3, 2004)]
[Graphical comparison of cycles 2, 10, 13, 17, 20 and 23 (last update December
3, 2004)]
[Historical solar and geomagnetic data charts 1954-2004 (last update November 8,
2004)]
[Archived reports (last update December 24, 2004)]
The geomagnetic field was quiet to unsettled on December 26. Solar wind speed ranged between 470 and 558 km/sec under the influence of a high speed stream from coronal hole CH135.
Solar flux measured at 20h UTC on 2.8 GHz was 91.7. The planetary A
index was 10 (STAR Ap - based on the mean of three hour interval ap indices: 9.9).
Three hour interval K indices: 33222322 (planetary), 33231222 (Boulder).
The background x-ray flux is at the class B1 level.
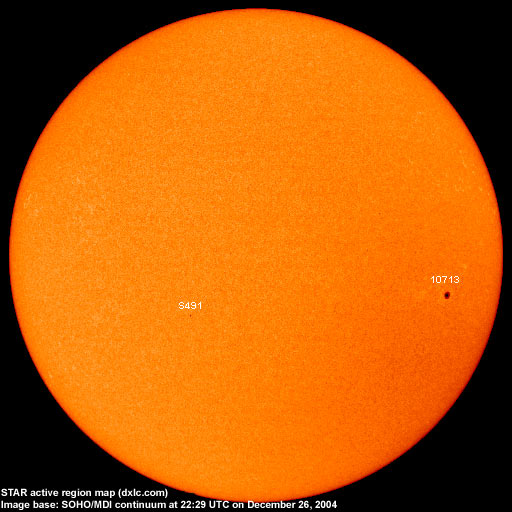
At midnight there were 2 spotted regions on the visible solar disk. The solar flare activity level was very low. No C class events were recorded during the day.
Region 10713 decayed slowly and was mostly quiet.Spotted regions not numbered by NOAA/SEC:
[S491] A new unipolar region emerged in the southeast quadrant on December 26. Location at midnight S16E15.
December 25-26: No obviously Earth directed CMEs observed.
December 24: A partial halo CME covering the entire east limb and the south pole was observed in LASCO C3 images after 16h
UTC. With a data gap in LASCO images after the CMEs observed in the morning and this CME, it is difficult to state if this CME was
actually a continuation of the CME then observed off of the southeast limb or a separate event. If it was a separate event (the
most likely possibility), its source would have been behind the southeast limb.
Coronal hole history (since late October 2002)
Compare today's report with the situation one solar rotation ago: 28
days ago 27 days ago 26 days ago
A recurrent coronal hole (CH135) in the northern hemisphere was in a geoeffective position on December 23-24.

Processed SOHO/EIT 284 image at 18:03 UTC on December 11. The darkest areas on the solar disk are likely coronal holes.
The geomagnetic field is expected to be quiet to unsettled on December 27. Quiet conditions are likely on December 28-30.
| Coronal holes (1) | Coronal mass ejections (2) | M and X class flares (3) |
1) Effects from a coronal hole could reach Earth within the next 5 days. When the high speed stream has arrived
the color changes to green.
2) Material from a CME is likely to impact Earth within 96 hours.
3) There is a possibility of either M or X class flares within the next 48 hours.
Green: 0-20% probability, Yellow: 20-60% probability, Red: 60-100% probability.
Long distance low and medium frequency (below 2 MHz) propagation along east-west paths over high and upper middle latitudes is fair. Propagation along long distance north-south paths is poor. Trans Atlantic propagation conditions are normally monitored every night on 1470 kHz. Dominant stations tonight: WLAM Lewiston ME. Propagation was best towards the northeastern parts of the USA and Canada. During the local morning opening on December 26 propagation was best on the lower frequencies with CHLN Trois Rivieres noted on 560 kHz, CHNC New Carlisle and CKTB St.Catherines on 610 kHz. WJR Detroit on 760 and WWL New Orleans on 870 kHz both had good signals.
Compare to the previous day's image.
Data for all numbered solar regions according to the Solar Region Summary provided by NOAA/SEC. Comments are my own, as is the STAR spot count (spots observed at or inside a few hours before midnight) and data for regions not numbered by SEC or where SEC has observed no spots. SEC active region numbers in the table below and in the active region map above are the historic SEC/USAF numbers.
| Active region | Date numbered | SEC spot count |
STAR spot count |
Location at midnight | Area | Classification | Comment |
|---|---|---|---|---|---|---|---|
| 10712 | 2004.12.17 | S11W67 | plage | ||||
| 10713 | 2004.12.17 | 6 | 1 | S08W47 | 0090 | CSO |
classification was HSX at midnight location: S10W52 |
| 10714 | 2004.12.22 | S03W53 | plage | ||||
| S491 | emerged on 2004.12.26 |
1 | S16E15 | 0010 | HRX | ||
| Total spot count: | 6 | 2 | |||||
| SSN: | 16 | 22 | |||||
| Month | Average solar flux at Earth |
International sunspot number | Smoothed sunspot number |
|---|---|---|---|
| 2000.04 | 184.2 | 125.5 | 120.8 cycle 23 sunspot max. |
| 2000.07 | 202.3 | 170.1 | 119.8 |
| 2001.12 | 235.1 | 132.2 | 114.6 (-0.9) |
| 2003.10 | 151.7 | 65.5 | 58.2 (-1.3) |
| 2003.11 | 140.8 | 67.3 | 56.7 (-1.5) |
| 2003.12 | 114.9 | 46.5 | 54.8 (-1.9) |
| 2004.01 | 114.1 | 37.3 | 52.0 (-2.8) |
| 2004.02 | 107.0 | 45.8 | 49.3 (-2.7) |
| 2004.03 | 112.0 | 49.1 | 47.1 (-2.2) |
| 2004.04 | 101.2 | 39.3 | 45.5 (-1.6) |
| 2004.05 | 99.8 | 41.5 | 43.9 (-1.6) |
| 2004.06 | 97.4 | 43.2 | (42.2 predicted, -1.7) |
| 2004.07 | 119.1 | 51.0 | (40.6 predicted, -1.6) |
| 2004.08 | 109.6 | 40.9 | (39.0 predicted, -1.6) |
| 2004.09 | 103.1 | 27.7 | (37.1 predicted, -1.9) |
| 2004.10 | 105.9 | 48.4 | (34.9 predicted, -2.2) |
| 2004.11 | 113.2 | 43.7 | (33.0 predicted, -1.9) |
| 2004.12 | 93.5 (1) | 29.8 (2) | (30.7 predicted, -2.3) |
1) Running average based on the daily 20:00 UTC observed solar flux value at 2800 MHz.
2) Unofficial, accumulated value based on the Boulder (NOAA/SEC) sunspot number. The official international sunspot number is typically
30-50% less.
This report has been prepared by Jan Alvestad. It is based partly on my own observations and analysis, and partly on data from some of these solar data sources. All time references are to the UTC day. Comments and suggestions are always welcome.
| [DX-Listeners' Club] |