
Last major update issued on December 29, 2004 at 05:00 UTC.
[Solar and geomagnetic data - last month (updated daily)]
[Solar wind and electron fluence charts (updated daily)]
[Solar cycles 21-23 (last update December 3, 2004)]
[Solar cycles 1-20]
[Graphical comparison of cycles 21, 22 and 23 (last update December 3, 2004)]
[Graphical comparison of cycles 2, 10, 13, 17, 20 and 23 (last update December
3, 2004)]
[Historical solar and geomagnetic data charts 1954-2004 (last update November 8,
2004)]
[Archived reports (last update December 24, 2004)]
The geomagnetic field was quiet to active on December 28. Solar wind speed ranged between 444 and 498 km/sec. A disturbance which began on December 27 intensified with the interplanetary magnetic field moderately southwards most of the day. This disturbance may have been related to a CME observed on December 24.
Solar flux measured at 20h UTC on 2.8 GHz was 105.2. The planetary A
index was 16 (STAR Ap - based on the mean of three hour interval ap indices: 15.5).
Three hour interval K indices: 32232344 (planetary), 32232344 (Boulder).
The background x-ray flux is at the class B4 level.
At midnight there were 2 spotted regions on the visible solar disk. The solar flare activity level was low. A total of 15 C class events were recorded during the day.
Region 10713 developed spots in the south and in the north, however, the main penumbra lost much of its area. Lots of flares were observed during the day, as were a multitude of small CMEs off of the southwest limb. Flares: C7.2 at 00:10, C2.3 at 06:09, C2.4 at 06:31, C1.1 at 09:06, C3.5 at 09:18, C1.9 at 09:32, C1.1 at 10:51, C4.3 at 12:35, C4.1 at 15:55, C1.8 at 20:09, C1.8 at 20:18, C1.9 at 20:29 and C3.5 at 20:57 UTC.December 26-28: No obviously Earth directed CMEs observed.
Coronal hole history (since late October 2002)
Compare today's report with the situation one solar rotation ago: 28
days ago 27 days ago 26 days ago
Recurrent trans equatorial coronal hole CH136 will rotate into a geoeffective position on December 31-January 1.

Processed SOHO/EIT 284 image at 18:03 UTC on December 11. The darkest areas on the solar disk are likely coronal holes.
The geomagnetic field is expected to be quiet to active on December 29 and quiet to unsettled on December 30-31.
| Coronal holes (1) | Coronal mass ejections (2) | M and X class flares (3) |
1) Effects from a coronal hole could reach Earth within the next 5 days. When the high speed stream has arrived
the color changes to green.
2) Material from a CME is likely to impact Earth within 96 hours.
3) There is a possibility of either M or X class flares within the next 48 hours.
Green: 0-20% probability, Yellow: 20-60% probability, Red: 60-100% probability.
Long distance low and medium frequency (below 2 MHz) propagation along east-west paths over high and upper middle latitudes is poor. Propagation along long distance north-south paths is poor. Trans Atlantic propagation conditions are normally monitored every night on 1470 kHz. Dominant stations tonight: Radio Cristal del Uruguay and WWNN. R�dio Metropolitana (Fortaleza) was at fair levels on 930 kHz.
Compare to the previous day's image.
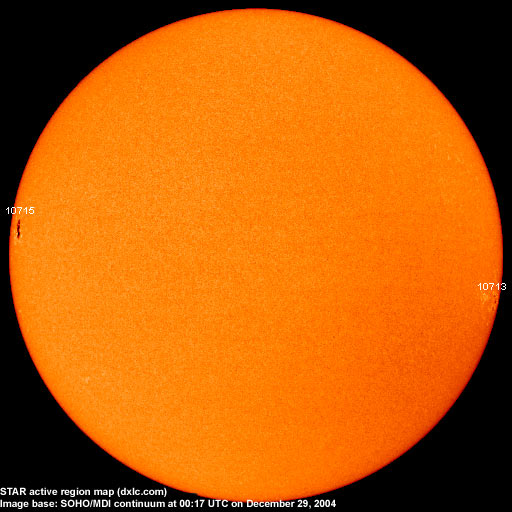
Data for all numbered solar regions according to the Solar Region Summary provided by NOAA/SEC. Comments are my own, as is the STAR spot count (spots observed at or inside a few hours before midnight) and data for regions not numbered by SEC or where SEC has observed no spots. SEC active region numbers in the table below and in the active region map above are the historic SEC/USAF numbers.
| Active region | Date numbered | SEC spot count |
STAR spot count |
Location at midnight | Area | Classification | Comment |
|---|---|---|---|---|---|---|---|
| 10713 | 2004.12.17 | 5 | 5 | S09W78 | 0150 | CSO |
beta-gamma classification was DAO at midnight, area 0070 location: S12W80 |
| 10714 | 2004.12.22 | S03W79 | plage | ||||
| 10715 | 2004.12.28 | 2 | 7 | N04E74 | 0080 | DAO |
beta-delta classification was DKC at midnight, area 0350 location: N06E74 |
| S491 | emerged on 2004.12.26 |
S16W11 | plage | ||||
| Total spot count: | 1 | 10 | |||||
| SSN: | 11 | 20 | |||||
| Month | Average solar flux at Earth |
International sunspot number | Smoothed sunspot number |
|---|---|---|---|
| 2000.04 | 184.2 | 125.5 | 120.8 cycle 23 sunspot max. |
| 2000.07 | 202.3 | 170.1 | 119.8 |
| 2001.12 | 235.1 | 132.2 | 114.6 (-0.9) |
| 2003.10 | 151.7 | 65.5 | 58.2 (-1.3) |
| 2003.11 | 140.8 | 67.3 | 56.7 (-1.5) |
| 2003.12 | 114.9 | 46.5 | 54.8 (-1.9) |
| 2004.01 | 114.1 | 37.3 | 52.0 (-2.8) |
| 2004.02 | 107.0 | 45.8 | 49.3 (-2.7) |
| 2004.03 | 112.0 | 49.1 | 47.1 (-2.2) |
| 2004.04 | 101.2 | 39.3 | 45.5 (-1.6) |
| 2004.05 | 99.8 | 41.5 | 43.9 (-1.6) |
| 2004.06 | 97.4 | 43.2 | (42.2 predicted, -1.7) |
| 2004.07 | 119.1 | 51.0 | (40.6 predicted, -1.6) |
| 2004.08 | 109.6 | 40.9 | (39.0 predicted, -1.6) |
| 2004.09 | 103.1 | 27.7 | (37.1 predicted, -1.9) |
| 2004.10 | 105.9 | 48.4 | (34.9 predicted, -2.2) |
| 2004.11 | 113.2 | 43.7 | (33.0 predicted, -1.9) |
| 2004.12 | 94.1 (1) | 31.0 (2) | (30.7 predicted, -2.3) |
1) Running average based on the daily 20:00 UTC observed solar flux value at 2800 MHz.
2) Unofficial, accumulated value based on the Boulder (NOAA/SEC) sunspot number. The official international sunspot number is typically
30-50% less.
This report has been prepared by Jan Alvestad. It is based partly on my own observations and analysis, and partly on data from some of these solar data sources. All time references are to the UTC day. Comments and suggestions are always welcome.
| [DX-Listeners' Club] |