
Last major update issued on January 10, 2004 at 05:30 UTC.
[Solar and geomagnetic data - last month (updated daily)]
[Solar wind and electron fluence charts (updated daily)]
[Solar cycles 21-23 (last update January 4, 2004)]
[Solar cycles 1-20]
[Graphical comparison of cycles 21, 22 and 23 (last update January 4, 2004)]
[Graphical comparison of cycles 2, 10, 13, 17, 20 and 23 (last update January
4, 2004)]
[Historical solar and geomagnetic data charts 1954-2003 (last update October 15, 2003)]
[Archived reports (last update January 9, 2004)]
The geomagnetic field was quiet to minor storm on January 9. Solar wind speed ranged between 476 and 677 km/sec. Two solar wind disturbances were observed during the day. After 05:30 UTC solar wind speed and density increased slowly and the interplanetary magnetic field swung moderately southwards. This caused a brief increase in geomagnetic activity to the minor storm level. While there was no obvious solar wind shock at about 15h UTC both ACE SWEPAM and EPAM data suggest that a CME arrived then. The source was likely the halo CME observed after the M8 event in region 10537 on January 7. A brief strong southward excursion of the IMF after 15:30 UTC was not associated with a significant increase in geomagnetic activity, after 16h UTC the IMF was mostly weakly to moderately southwards.
Solar flux measured at 20h UTC on 2.8 GHz was 118.4. The planetary A
index was 21 (STAR Ap - based on the mean of three hour interval ap indices: 21.1).
Three hour interval K indices: 23543433 (planetary), 33543432 (Boulder).
The background x-ray flux is at the class B3 level.
At midnight there were 2 spotted regions on the visible disk. Solar flare activity was moderate. A total of 4 C and 2 M class events was recorded during the day.
Region 10536 decayed fairly quickly in the main penumbral area, most of the positive polarity spots in the southeast
disappeared. If this development continues the magnetic delta structure in that area will soon disappear as well. Interestingly
several small areas of negative polarity emerged in the trailing part of the region and many new trailing spots emerged. An M flare
is possible. Flares: C1.0 at 19:58 and C1.0 at 23:08 UTC.
Region 10537 decayed slowly with the main penumbra losing some of its areal coverage. There is still a fairly strong magnetic delta in
the central part of the region. A major flare is possible. Flares: M1.1/2N at 01:22, M3.2 at 01:44,
C1.4/1F at 05:08 and C1.8 at 18:44 UTC.
January 9: No partly or fully earth directed CMEs observed.
January 8: A partial halo CME was observed, mainly off of the east limbs, after an M1.3 flare in region 10537 at 05:07 UTC.
January 7: A fast and wide halo CME was observed in LASCO C3 images after the M8 flare in region 10537. Most of the ejected material was observed off of the east limb with the leading edge of the second CME having a speed in excess of 1700 km/sec.
A filament to the west and southwest of region 10536 erupted before 18h UTC. A partial halo CME was observed in LASCO images with ejected material observed off of the south and west limbs.
Coronal hole history (since late October 2002)
Compare today's report with the situation one solar rotation ago: 28
days ago 27 days ago 26 days ago
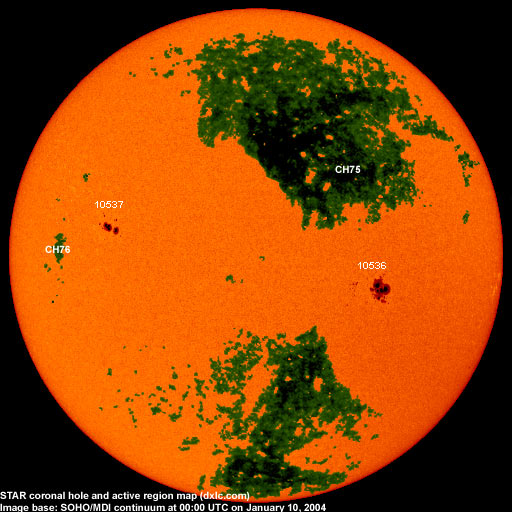
The southernmost extension of a coronal hole (CH75) in the northern hemisphere could be in a geoeffective position on January 9. A recurrent trans equatorial coronal hole (CH76) will rotate into a geoeffective position on January 13-14.

Processed SOHO/EIT 284 image at 01:06 UTC on January 10. The darkest areas on the solar disk are likely coronal holes.
The geomagnetic field is expected to be mostly unsettled to active on January 10 with a possibility of brief minor storming if a CME associated with a filament eruption near region 10536 on January 7 arrives. Quiet to active is likely on January 11. A high speed stream from coronal hole CH75 may cause unsettled to active conditions on January 12.
Long distance low frequency (below 2 MHz) propagation along east-west paths over high and upper middle latitudes is poor. Propagation along long distance north-south paths is fair to poor. [Trans Atlantic propagation conditions are currently monitored every night on 1470 kHz. Dominant stations tonight: Radio Cristal del Uruguay on the southwesterly longwire, Radio Vibraci�n (Venezuela) on the EWEs directed west and northwest. Only a few east coast US stations were noted with the best signals coming from WWZN Boston on 1510 and WTOP Washington DC on 1500 kHz].
| Coronal holes (1) | Coronal mass ejections (2) | M and X class flares (3) |
1) Effects from a coronal hole could reach Earth within the next 5 days. When the high speed stream has arrived
the color changes to green.
2) Material from a CME is likely to impact Earth within 96 hours.
3) There is a possibility of either M or X class flares within the next 48 hours.
Green: 0-20% probability, Yellow: 20-60% probability, Red: 60-100% probability.
Compare to the previous day's image.
Data for all numbered solar regions according to the Solar Region Summary provided by NOAA/SEC. Comments are my own, as is the STAR spot count (spots observed at or inside a few hours before midnight) and data for regions not numbered by SEC or where SEC has observed no spots. SEC active region numbers in the table below and in the active region map above are the historic SEC/USAF numbers.
| Active region | Date numbered | SEC spot count |
STAR spot count |
Location at midnight | Area | Classification | Comment |
|---|---|---|---|---|---|---|---|
| 10534 | 2003.12.31 | S07W79 | plage | ||||
| 10536 | 2004.01.01 | 49 | 53 | S12W28 | 0600 | EKC | beta-gamma-delta |
| 10537 | 2004.01.06 | 19 | 24 | N05E37 | 0270 | CKO |
beta-gamma-delta classification was DAI at midnight |
| 10538 | 2004.01.07 | N05W17 | plage | ||||
| 10539 | 2004.01.07 | N09E02 | plage | ||||
| Total spot count: | 68 | 77 | |||||
| SSN: | 88 | 97 | |||||
| Month | Average solar flux at Earth |
International sunspot number | Smoothed sunspot number |
|---|---|---|---|
| 2000.04 | 184.2 | 125.5 | 120.8 cycle 23 sunspot max. |
| 2000.07 | 202.3 | 170.1 | 119.8 |
| 2001.12 | 235.1 | 132.2 | 114.6 (-0.9) |
| 2002.12 | 157.2 | 80.8 | 82.0 (-3.2) |
| 2003.01 | 144.0 | 79.7 | 80.8 (-1.2) |
| 2003.02 | 124.5 | 46.0 | 78.3 (-2.5) |
| 2003.03 | 131.4 | 61.1 | 74.0 (-4.3) |
| 2003.04 | 126.4 | 60.0 | 70.1 (-3.9) |
| 2003.05 | 115.7 | 55.2 | 67.6 (-2.5) |
| 2003.06 | 129.3 | 77.4 | 65.0 (-2.6) |
| 2003.07 | 127.7 | 83.3 | (62.0 predicted, -3.0) |
| 2003.08 | 122.1 | 72.7 | (59.4 predicted, -2.6) |
| 2003.09 | 112.2 | 48.7 | (57.5 predicted, -1.9) |
| 2003.10 | 151.7 | 65.6 | (54.7 predicted, -2.8) |
| 2003.11 | 140.8 | 67.2 | (52.0 predicted, -2.7) |
| 2003.12 | 114.9 | 47.0 | (49.4 predicted, -2.6) |
| 2004.01 | 118.4 (1) | 22.6 (2) | (45.3 predicted, -4.1) |
1) Running average based on the daily 20:00 UTC observed solar flux value at 2800 MHz.
2) Unofficial, accumulated value based on the Boulder (NOAA/SEC) sunspot number. The official international sunspot number is typically
30-50% less.
This report has been prepared by Jan Alvestad. It is based partly on my own observations and analysis, and partly on data from sources noted in solar links. All time references are to the UTC day. Comments and suggestions are always welcome.
| [DX-Listeners' Club] |