
Last major update issued on May 21, 2004 at 03:35 UTC.
[Solar and geomagnetic data - last month (updated daily)]
[Solar wind and electron fluence charts (updated daily)]
[Solar cycles 21-23 (last update May 3, 2004)]
[Solar cycles 1-20]
[Graphical comparison of cycles 21, 22 and 23 (last update May 3, 2004)]
[Graphical comparison of cycles 2, 10, 13, 17, 20 and 23 (last update May 3, 2004)]
[Historical solar and geomagnetic data charts 1954-2004 (last update April 28,
2004)]
[Archived reports (last update May 18, 2004)]
The geomagnetic field was quiet to minor storm on May 20. Solar wind speed ranged between 348 and 553 km/sec, slowly increasing all day under the influence of a high speed stream from coronal hole CH96.
Solar flux measured at 20h UTC on 2.8 GHz was 104.6. The planetary A
index was 13 (STAR Ap - based on the mean of three hour interval ap indices: 14.1 ).
Three hour interval K indices: 22352233 (planetary), 21353333 (Boulder).
The background x-ray flux is at the class B2-B3 level.
At midnight there were 5 spotted regions on the visible disk. The solar flare activity level was low. A total of 3 C class events was recorded during the day.
Region 10609 decayed slowly and quietly, the trailing spots could disappear before the region rotates out of view at the
southwest limb late today or early tomorrow.
Region 10613 was quiet and stable.
Region 10615 was quiet, a new spot emerged to the north of the single penumbra.
Region 10617 decayed slowly and quietly.
New region 10618 rotated partly into view late on May 19 at the southeast limb and was numbered the next day by SEC. The
region is somewhat complex with a magnetic delta structure in the single penumbra. A small area of negative polarity in the north
has positive polarity at its southern and eastern borders. C flares are likely and there is a small chance of a minor M class
flare. Flares: C2.5 at 01:!8, C1.1 at 05:04 and C3.7 at 17:19 UTC.
May 18-20: No fully or partly Earth directed CME observed.
Coronal hole history (since late October 2002)
Compare today's report with the situation one solar rotation ago: 28
days ago 27 days ago 26 days ago
A small, recurrent coronal hole (CH96) in the southern hemisphere was in a geoeffective position on May 17. A recurrent, poorly defined coronal hole (CH97) in the northern hemisphere was in a geoeffective position on May 19-20.

Processed SOHO/EIT 284 image at 01:05 UTC on May 21. The darkest areas on the solar disk are likely coronal holes.
The geomagnetic field is expected to be quiet to unsettled on May 21 as the high speed stream from corona hole CH96 becomes less influential. Another weak coronal hole flow could arrive on May 22 and cause some unsettled to active intervals that day and on May 23.
| Coronal holes (1) | Coronal mass ejections (2) | M and X class flares (3) |
1) Effects from a coronal hole could reach Earth within the next 5 days. When the high speed stream has arrived
the color changes to green.
2) Material from a CME is likely to impact Earth within 96 hours.
3) There is a possibility of either M or X class flares within the next 48 hours.
Green: 0-20% probability, Yellow: 20-60% probability, Red: 60-100% probability.
Long distance low and medium frequency (below 2 MHz) propagation along east-west paths over high and upper middle latitudes is very poor. Propagation along long distance north-south paths is fair to good. Trans Atlantic propagation conditions are monitored every night on 1470 kHz. Dominant station tonight: Radio Vibraci�n (Venezuela) with a strong signal after local sunrise, prior to that several stations were noted: Radio Cristal del Uruguay, CPN Radio (Per�) and 2-3 stations from Brazil. On other frequencies R�dio Itapirema on 1390 kHz was a surprise while R�dio 9 de Julho on 1600 kHz was there as expected with a good signal.
Compare to the previous day's image.
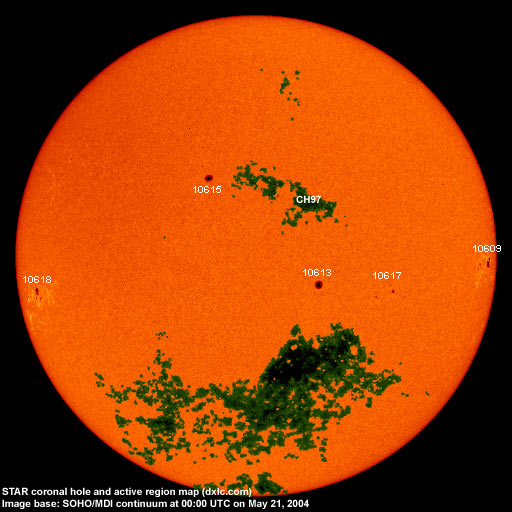
Data for all numbered solar regions according to the Solar Region Summary provided by NOAA/SEC. Comments are my own, as is the STAR spot count (spots observed at or inside a few hours before midnight) and data for regions not numbered by SEC or where SEC has observed no spots. SEC active region numbers in the table below and in the active region map above are the historic SEC/USAF numbers.
| Active region | Date numbered | SEC spot count |
STAR spot count |
Location at midnight | Area | Classification | Comment |
|---|---|---|---|---|---|---|---|
| 10606 | 2004.05.07 | 2 | S10W89 | 0060 | CAO | rotated out of view | |
| 10608 | 2004.05.09 | S04W78 | plage | ||||
| 10609 | 2004.05.10 | 8 | 7 | S03W70 | 0160 | DAO |
area was 0080 at midnight |
| 10610 | 2004.05.12 | S01W89 | plage | ||||
| 10612 | 2004.05.13 | 3 | N10W81 | 0010 | BXO | spotless | |
| 10613 | 2004.05.13 | 1 | 1 | S09W14 | 0120 | HSX |
area was 0090 at midnight |
| 10615 | 2004.05.16 | 4 | 5 | N18E14 | 0090 | HAX |
classification was CAO at midnight |
| 10616 | 2004.05.16 | N07E17 | plage | ||||
| 10617 | 2004.05.17 | 13 | 9 | S10W32 | 0050 | DAO |
area was 0030 at midnight |
| 10618 | 2004.05.20 | 8 | 14 | S10E69 | 0030 | CSO |
beta-gamma-delta formerly region S405 classification was DAO at midnight, area 0060 |
| Total spot count: | 39 | 36 | |||||
| SSN: | 109 | 86 | |||||
| Month | Average solar flux at Earth |
International sunspot number | Smoothed sunspot number |
|---|---|---|---|
| 2000.04 | 184.2 | 125.5 | 120.8 cycle 23 sunspot max. |
| 2000.07 | 202.3 | 170.1 | 119.8 |
| 2001.12 | 235.1 | 132.2 | 114.6 (-0.9) |
| 2003.04 | 126.4 | 60.0 | 70.1 (-3.9) |
| 2003.05 | 115.7 | 55.2 | 67.6 (-2.5) |
| 2003.06 | 129.3 | 77.4 | 65.0 (-2.6) |
| 2003.07 | 127.7 | 83.3 | 61.8 (-3.2) |
| 2003.08 | 122.1 | 72.7 | 60.0 (-1.8) |
| 2003.09 | 112.2 | 48.7 | 59.5 (-0.5) |
| 2003.10 | 151.7 | 65.5 | 58.1 (-1.4) |
| 2003.11 | 140.8 | 67.3 | (56.5 predicted, -1.6) |
| 2003.12 | 114.9 | 46.5 | (53.5 predicted, -3.0) |
| 2004.01 | 114.1 | 37.2 | (49.1 predicted, -4.4) |
| 2004.02 | 107.0 | 46.0 | (44.8 predicted, -4.3) |
| 2004.03 | 112.0 | 48.9 | (42.1 predicted, -2.7) |
| 2004.04 | 101.2 | 39.3 | (40.0 predicted, -2.1) |
| 2004.05 | 98.5 (1) | 48.8 (2) | (36.8 predicted, -3.2) |
1) Running average based on the daily 20:00 UTC observed solar flux value at 2800 MHz.
2) Unofficial, accumulated value based on the Boulder (NOAA/SEC) sunspot number. The official international sunspot number is typically
30-50% less.
This report has been prepared by Jan Alvestad. It is based partly on my own observations and analysis, and partly on data from some of these solar data sources. All time references are to the UTC day. Comments and suggestions are always welcome.
| [DX-Listeners' Club] |