
Last major update issued on October 6, 2004 at 03:55 UTC.
[Solar and geomagnetic data - last month (updated daily)]
[Solar wind and electron fluence charts (updated daily)]
[Solar cycles 21-23 (last update October 2, 2004)]
[Solar cycles 1-20]
[Graphical comparison of cycles 21, 22 and 23 (last update October 2, 2004)]
[Graphical comparison of cycles 2, 10, 13, 17, 20 and 23 (last update October 2, 2004)]
[Historical solar and geomagnetic data charts 1954-2004 (last update August 28,
2004)]
[Archived reports (last update September 27, 2004)]
The geomagnetic field was quiet on October 5. Solar wind speed ranged between 321 and 372 km/sec.
Solar flux measured at 20h UTC on 2.8 GHz was 90.8. The planetary A
index was 5 (STAR Ap - based on the mean of three hour interval ap indices: 6.3).
Three hour interval K indices: 22201222 (planetary), 22211101 (Boulder).
The background x-ray flux is at the class A8 level.
At midnight there were 3 spotted regions on the visible disk. The solar flare activity level was low. A single C class event was recorded during the day.
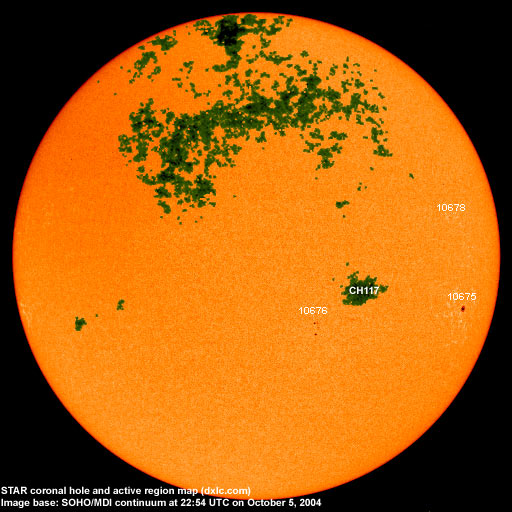
Region 10675 decayed slowly and quietly.
Region 10676 decayed slowly and quietly.
Region 10678 decayed and had a tiny spot left by the end of the day. The region could become spotless today.
A region at the southeast limb continued to produce small flares. Flare: C1.4 at 00:56 UTC.
October 3-5: No obviously Earth directed CMEs observed.
Coronal hole history (since late October 2002)
Compare today's report with the situation one solar rotation ago: 28
days ago 27 days ago 26 days ago
A trans equatorial coronal hole (CH117) was in a geoeffective position on October 3-4.
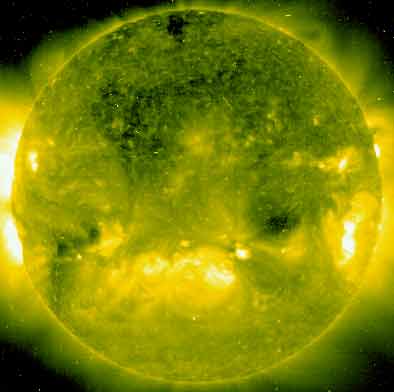
Processed SOHO/EIT 284 image at 19:06 UTC on October 5. The darkest areas on the solar disk are likely coronal holes.
The geomagnetic field is expected to be quiet to active on October 6-7 due to effects from coronal hole CH117. Quiet to unsettled is likely on October 8-9.
| Coronal holes (1) | Coronal mass ejections (2) | M and X class flares (3) |
1) Effects from a coronal hole could reach Earth within the next 5 days. When the high speed stream has arrived
the color changes to green.
2) Material from a CME is likely to impact Earth within 96 hours.
3) There is a possibility of either M or X class flares within the next 48 hours.
Green: 0-20% probability, Yellow: 20-60% probability, Red: 60-100% probability.
Long distance low and medium frequency (below 2 MHz) propagation along east-west paths over high and upper middle latitudes is fair. Propagation along long distance north-south paths is poor. Trans Atlantic propagation conditions are monitored every night on 1470 kHz. Dominant stations tonight: WLAM Lewiston ME and Radio Vibraci�n (Venezuela). Propagation was best towards the Caribbean and the easternmost parts of North America. Fair to good signals were noted from a number of stations located on Newfoundland, Nova Scotia and in the New York and Boston areas.
There was only a minor local sunrise opening on October 5 with most of the stations observed from Venezuela and Cuba. An interesting Spanish language station was noted on 1469.85 kHz, but I could only get pieces of audio.
Compare to the previous day's image.
Data for all numbered solar regions according to the Solar Region Summary provided by NOAA/SEC. Comments are my own, as is the STAR spot count (spots observed at or inside a few hours before midnight) and data for regions not numbered by SEC or where SEC has observed no spots. SEC active region numbers in the table below and in the active region map above are the historic SEC/USAF numbers.
| Active region | Date numbered | SEC spot count |
STAR spot count |
Location at midnight | Area | Classification | Comment |
|---|---|---|---|---|---|---|---|
| 10675 | 2004.09.25 | 1 | 3 | S11W59 | 0070 | HSX |
classification was CSO at midnight |
| 10676 | 2004.09.28 | 8 | 6 | S12W15 | 0040 | CSO |
area was 0030 at midnight |
| 10677 | 2004.09.28 | N02W60 | plage | ||||
| 10678 | 2004.10.03 | 1 | 1 | N13W58 | 0010 | AXX | |
| S456 | emerged on 2004.09.29 |
N16W34 | plage | ||||
| S457 | emerged on 2004.09.29 |
S08W84 | plage | ||||
| Total spot count: | 10 | 10 | |||||
| SSN: | 40 | 40 | |||||
| Month | Average solar flux at Earth |
International sunspot number | Smoothed sunspot number |
|---|---|---|---|
| 2000.04 | 184.2 | 125.5 | 120.8 cycle 23 sunspot max. |
| 2000.07 | 202.3 | 170.1 | 119.8 |
| 2001.12 | 235.1 | 132.2 | 114.6 (-0.9) |
| 2003.08 | 122.1 | 72.7 | 60.0 (-1.7) |
| 2003.09 | 112.2 | 48.7 | 59.5 (-0.5) |
| 2003.10 | 151.7 | 65.5 | 58.2 (-1.3) |
| 2003.11 | 140.8 | 67.3 | 56.7 (-1.5) |
| 2003.12 | 114.9 | 46.5 | 54.8 (-1.9) |
| 2004.01 | 114.1 | 37.3 | 52.0 (-2.8) |
| 2004.02 | 107.0 | 45.8 | 49.3 (-2.7) |
| 2004.03 | 112.0 | 49.1 | 47.1 (-2.2) |
| 2004.04 | 101.2 | 39.3 | (44.6 predicted, -2.5) |
| 2004.05 | 99.8 | 41.5 | (40.9 predicted, -3.7) |
| 2004.06 | 97.4 | 43.2 | (38.0 predicted, -2.9) |
| 2004.07 | 119.1 | 51.0 | (36.2 predicted, -1.8) |
| 2004.08 | 109.6 | 40.9 | (34.6 predicted, -1.6) |
| 2004.09 | 103.1 | 27.7 | (32.8 predicted, -1.6) |
| 2004.10 | 89.3 (1) | 6.2 (2) | (30.5 predicted, -2.3) |
1) Running average based on the daily 20:00 UTC observed solar flux value at 2800 MHz.
2) Unofficial, accumulated value based on the Boulder (NOAA/SEC) sunspot number. The official international sunspot number is typically
30-50% less.
This report has been prepared by Jan Alvestad. It is based partly on my own observations and analysis, and partly on data from some of these solar data sources. All time references are to the UTC day. Comments and suggestions are always welcome.
| [DX-Listeners' Club] |