
Last major update issued on October 8, 2004 at 03:55 UTC.
[Solar and geomagnetic data - last month (updated daily)]
[Solar wind and electron fluence charts (updated daily)]
[Solar cycles 21-23 (last update October 2, 2004)]
[Solar cycles 1-20]
[Graphical comparison of cycles 21, 22 and 23 (last update October 2, 2004)]
[Graphical comparison of cycles 2, 10, 13, 17, 20 and 23 (last update October 2, 2004)]
[Historical solar and geomagnetic data charts 1954-2004 (last update August 28,
2004)]
[Archived reports (last update September 27, 2004)]
The geomagnetic field was quiet on October 7. Solar wind speed ranged between 273 and 291 km/sec. Since midnight solar wind speed and density have been increasing slowly. This may be the arrival of a slow coronal flow from coronal hole CH117.
Solar flux measured at 20h UTC on 2.8 GHz was 93.8. The planetary A
index was 4 (STAR Ap - based on the mean of three hour interval ap indices: 5.8).
Three hour interval K indices: 12112222 (planetary), 12112210 (Boulder).
The background x-ray flux is at the class B1 level.
At midnight there were 2 spotted regions on the visible disk. The solar flare activity level was very low. No C class events was recorded during the day.
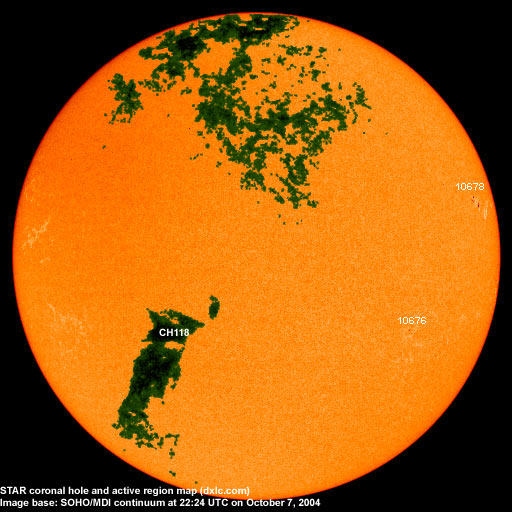
Region 10676 decayed slowly and quietly and could soon become spotless.
Region 10678 developed fairly quickly late in the day. Currently there is no obvious separation between the positive and
negative polarity fields and further development could cause a magnetic delta structure to form. C flares are possible at this
time. The region will rotate out of view late today.
October 5-7: No obviously Earth directed CMEs observed.
Coronal hole history (since late October 2002)
Compare today's report with the situation one solar rotation ago: 28
days ago 27 days ago 26 days ago
A trans equatorial coronal hole (CH117) was in a geoeffective position on October 3-4. A recurrent coronal hole (CH118) in the southern hemisphere could rotate to a geoeffective position on October 8-9. A southward (poorly defined) extension of the large northern polar coronal hole may have been in a geoeffective position on October 7.
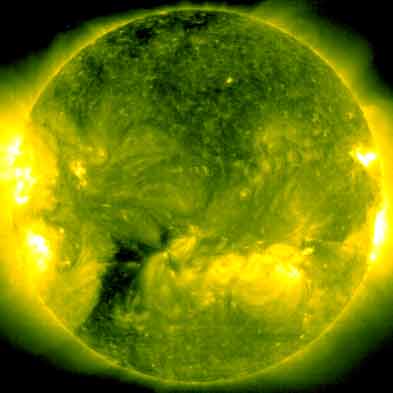
Processed SOHO/EIT 284 image at 13:06 UTC on October 7. The darkest areas on the solar disk are likely coronal holes.
The geomagnetic field is expected to be quiet to unsettled on October 8 due to minor effects from coronal hole CH117. Quiet is likely on October 9-10 with unsettled to active conditions possible on October 11-12 due to a coronal flow from coronal hole CH118.
| Coronal holes (1) | Coronal mass ejections (2) | M and X class flares (3) |
1) Effects from a coronal hole could reach Earth within the next 5 days. When the high speed stream has arrived
the color changes to green.
2) Material from a CME is likely to impact Earth within 96 hours.
3) There is a possibility of either M or X class flares within the next 48 hours.
Green: 0-20% probability, Yellow: 20-60% probability, Red: 60-100% probability.
Long distance low and medium frequency (below 2 MHz) propagation along east-west paths over high and upper middle latitudes is fair to good. Propagation along long distance north-south paths is poor to fair. Trans Atlantic propagation conditions are monitored every night on 1470 kHz. Dominant station tonight: WLAM Lewiston ME. On other frequencies propagation was best towards the northeastern part of the USA. Stations like 1480 WSAR Fall River MA and 1600 WUNR Brookline MA were heard with good signals.
The local sunrise opening on October 7 was only fair with a mix of stations from the easternmost part of North America, the Caribbean and the northern parts of South America.
Compare to the previous day's image.
Data for all numbered solar regions according to the Solar Region Summary provided by NOAA/SEC. Comments are my own, as is the STAR spot count (spots observed at or inside a few hours before midnight) and data for regions not numbered by SEC or where SEC has observed no spots. SEC active region numbers in the table below and in the active region map above are the historic SEC/USAF numbers.
| Active region | Date numbered | SEC spot count |
STAR spot count |
Location at midnight | Area | Classification | Comment |
|---|---|---|---|---|---|---|---|
| 10675 | 2004.09.25 | 1 | S10W89 | 0060 | HSX | rotated out of view | |
| 10676 | 2004.09.28 | 1 | 2 | S13W41 | 0020 | HSX |
classification was CRO at midnight, area 0010 |
| 10677 | 2004.09.28 | N02W86 | plage | ||||
| 10678 | 2004.10.03 | 6 | 10 | N12W75 | 0060 | DRO |
classification was DAO at midnight |
| S456 | emerged on 2004.09.29 |
N16W60 | plage | ||||
| Total spot count: | 8 | 12 | |||||
| SSN: | 38 | 32 | |||||
| Month | Average solar flux at Earth |
International sunspot number | Smoothed sunspot number |
|---|---|---|---|
| 2000.04 | 184.2 | 125.5 | 120.8 cycle 23 sunspot max. |
| 2000.07 | 202.3 | 170.1 | 119.8 |
| 2001.12 | 235.1 | 132.2 | 114.6 (-0.9) |
| 2003.08 | 122.1 | 72.7 | 60.0 (-1.7) |
| 2003.09 | 112.2 | 48.7 | 59.5 (-0.5) |
| 2003.10 | 151.7 | 65.5 | 58.2 (-1.3) |
| 2003.11 | 140.8 | 67.3 | 56.7 (-1.5) |
| 2003.12 | 114.9 | 46.5 | 54.8 (-1.9) |
| 2004.01 | 114.1 | 37.3 | 52.0 (-2.8) |
| 2004.02 | 107.0 | 45.8 | 49.3 (-2.7) |
| 2004.03 | 112.0 | 49.1 | 47.1 (-2.2) |
| 2004.04 | 101.2 | 39.3 | (44.6 predicted, -2.5) |
| 2004.05 | 99.8 | 41.5 | (40.9 predicted, -3.7) |
| 2004.06 | 97.4 | 43.2 | (38.0 predicted, -2.9) |
| 2004.07 | 119.1 | 51.0 | (36.2 predicted, -1.8) |
| 2004.08 | 109.6 | 40.9 | (34.6 predicted, -1.6) |
| 2004.09 | 103.1 | 27.7 | (32.8 predicted, -1.6) |
| 2004.10 | 90.3 (1) | 8.7 (2) | (30.5 predicted, -2.3) |
1) Running average based on the daily 20:00 UTC observed solar flux value at 2800 MHz.
2) Unofficial, accumulated value based on the Boulder (NOAA/SEC) sunspot number. The official international sunspot number is typically
30-50% less.
This report has been prepared by Jan Alvestad. It is based partly on my own observations and analysis, and partly on data from some of these solar data sources. All time references are to the UTC day. Comments and suggestions are always welcome.
| [DX-Listeners' Club] |