
Last major update issued on October 25, 2004 at 07:00 UTC.
[Solar and geomagnetic data - last month (updated daily)]
[Solar wind and electron fluence charts (updated daily)]
[Solar cycles 21-23 (last update October 2, 2004)]
[Solar cycles 1-20]
[Graphical comparison of cycles 21, 22 and 23 (last update October 2, 2004)]
[Graphical comparison of cycles 2, 10, 13, 17, 20 and 23 (last update October 2, 2004)]
[Historical solar and geomagnetic data charts 1954-2004 (last update August 28,
2004)]
[Archived reports (last update October 18, 2004)]
The geomagnetic field was quiet to active on October 24. Solar wind speed ranged between 353 and 533 km/sec. A high speed stream from coronal hole CH120 arrived early in the day, near 03 UTC at SOHO. No significant geomagnetic effects were observed until the latter half of the day.
Solar flux measured at 20h UTC on 2.8 GHz was 140.2. The planetary A
index was 9 (STAR Ap - based on the mean of three hour interval ap indices: 8.9).
Three hour interval K indices: 20012342 (planetary), 21012333 (Boulder).
The background x-ray flux is at the class B4 level.
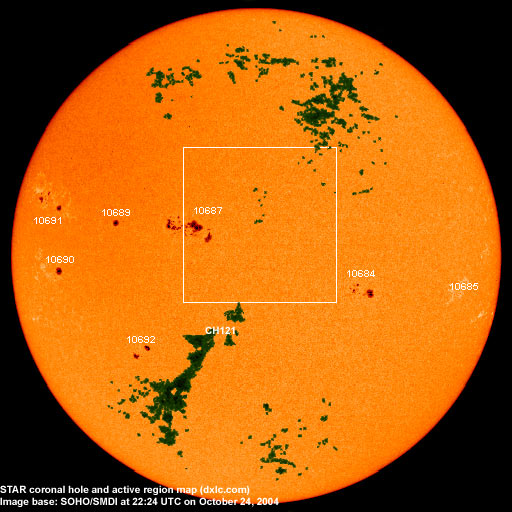
At midnight there were 7 spotted regions on the visible solar disk. The solar flare activity level was moderate. A total of 7 C and 1 M class events was recorded during the day. Two flares had their origin at and behind the southwest limb in old region 10682: C2.1 at 18:24 and C5.5 at 21:51 UTC.
Region 10684 decayed quickly and was mostly quiet.October 22-24: No obviously Earth directed CMEs observed.
Coronal hole history (since late October 2002)
Compare today's report with the situation one solar rotation ago: 28
days ago 27 days ago 26 days ago
A recurrent coronal hole (CH120) - an extension of the northern polar coronal hole - was in a geoeffective position on October 19-22. A coronal hole (CH121) in the southern hemisphere will be in a geoeffective position on October 25-26.
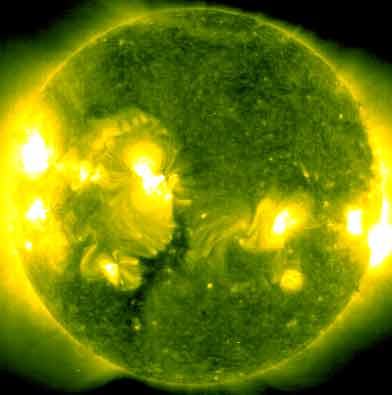
Processed SOHO/EIT 284 image at 01:06 UTC on October 25. The darkest areas on the solar disk are likely coronal holes.
The geomagnetic field is expected to be quiet to active on October 25 and quiet to unsettled on October 26-28. Quiet to active is possible on October 29-30 due to effects from coronal hole CH121.
| Coronal holes (1) | Coronal mass ejections (2) | M and X class flares (3) |
1) Effects from a coronal hole could reach Earth within the next 5 days. When the high speed stream has arrived
the color changes to green.
2) Material from a CME is likely to impact Earth within 96 hours.
3) There is a possibility of either M or X class flares within the next 48 hours.
Green: 0-20% probability, Yellow: 20-60% probability, Red: 60-100% probability.
Long distance low and medium frequency (below 2 MHz) propagation along east-west paths over high and upper middle latitudes is fair. Propagation along long distance north-south paths is poor. Trans Atlantic propagation conditions are normally monitored every night on 1470 kHz. Dominant station tonight: unknown - no listening activities. Propagation conditions were very good during the first half of October 24 with a huge number of stations from North America received. Signal levels were at times exceptional and reception was possible more than 3 hours past local sunrise.
Compare to the previous day's image.
Data for all numbered solar regions according to the Solar Region Summary provided by NOAA/SEC. Comments are my own, as is the STAR spot count (spots observed at or inside a few hours before midnight) and data for regions not numbered by SEC or where SEC has observed no spots. SEC active region numbers in the table below and in the active region map above are the historic SEC/USAF numbers.
| Active region | Date numbered | SEC spot count |
STAR spot count |
Location at midnight | Area | Classification | Comment |
|---|---|---|---|---|---|---|---|
| 10682 | 2004.10.13 | 4 | S12W86 | 0030 | CAO | rotated out of view | |
| 10684 | 2004.10.17 | 24 | 16 | S04W27 | 0150 | DAI | |
| 10685 | 2004.10.18 | 3 | 1 | S07W56 | 0020 | AXX |
area was 0000 at midnight |
| 10687 | 2004.10.19 | 44 | 61 | N12E15 | 0280 | EKI |
beta-delta classification was EKC at midnight, area 0500 |
| 10689 | 2004.10.21 | 1 | 1 | N11E34 | 0050 | HSX |
area was 0070 at midnight |
| 10690 | 2004.10.22 | 3 | 2 | N00E53 | 0070 | HAX |
area was 0090 at midnight |
| 10691 | 2004.10.23 | 11 | 13 | N15E59 | 0150 | EAI | beta-gamma-delta |
| 10692 | 2004.10.24 | 8 | 11 | S17E30 | 0070 | DAO |
beta-delta area was 0100 at midnight |
| Total spot count: | 98 | 114 | |||||
| SSN: | 178 | 184 | |||||
| Month | Average solar flux at Earth |
International sunspot number | Smoothed sunspot number |
|---|---|---|---|
| 2000.04 | 184.2 | 125.5 | 120.8 cycle 23 sunspot max. |
| 2000.07 | 202.3 | 170.1 | 119.8 |
| 2001.12 | 235.1 | 132.2 | 114.6 (-0.9) |
| 2003.08 | 122.1 | 72.7 | 60.0 (-1.7) |
| 2003.09 | 112.2 | 48.7 | 59.5 (-0.5) |
| 2003.10 | 151.7 | 65.5 | 58.2 (-1.3) |
| 2003.11 | 140.8 | 67.3 | 56.7 (-1.5) |
| 2003.12 | 114.9 | 46.5 | 54.8 (-1.9) |
| 2004.01 | 114.1 | 37.3 | 52.0 (-2.8) |
| 2004.02 | 107.0 | 45.8 | 49.3 (-2.7) |
| 2004.03 | 112.0 | 49.1 | 47.1 (-2.2) |
| 2004.04 | 101.2 | 39.3 | (44.6 predicted, -2.5) |
| 2004.05 | 99.8 | 41.5 | (40.9 predicted, -3.7) |
| 2004.06 | 97.4 | 43.2 | (38.0 predicted, -2.9) |
| 2004.07 | 119.1 | 51.0 | (36.2 predicted, -1.8) |
| 2004.08 | 109.6 | 40.9 | (34.6 predicted, -1.6) |
| 2004.09 | 103.1 | 27.7 | (32.8 predicted, -1.6) |
| 2004.10 | 90.6 (1) | 22.8 (2) | (30.5 predicted, -2.3) |
1) Running average based on the daily 20:00 UTC observed solar flux value at 2800 MHz.
2) Unofficial, accumulated value based on the Boulder (NOAA/SEC) sunspot number. The official international sunspot number is typically
30-50% less.
This report has been prepared by Jan Alvestad. It is based partly on my own observations and analysis, and partly on data from some of these solar data sources. All time references are to the UTC day. Comments and suggestions are always welcome.
| [DX-Listeners' Club] |