
Last major update issued on August 13, 2005 at 03:40 UTC. First SIGNS oF cycle 24
[Solar and
geomagnetic data - last month (updated daily)]
[Solar wind and
electron fluence charts (updated daily)]
[Solar cycles 21-23
(last update August 2, 2005)]
[Solar cycles 1-20]
[Graphical comparison
of cycles 21, 22 and 23 (last update August 2, 2005)]
[Graphical
comparison of cycles 2, 10, 13, 17, 20 and 23 (last update August 2, 2005)]
[Historical solar and
geomagnetic data charts 1954-2004 (last update February 1, 2005)]
[Archived reports
(last update August 13, 2005)]
The geomagnetic field was quiet to unsettled on August 12. Solar wind speed ranged between 345 and 357 (all day average 348) km/sec. What was likely a solar wind shock was observed at SOHO near 02h UTC on August. Solar wind speed increased abruptly from 371 to 419 km/sec at 02:01 UTC. There is a chance that this was the arrival of a low speed stream from CH180.
Solar flux measured at 20h UTC on 2.8 GHz was 76.2. The planetary
A
index was 6 (STAR Ap - based on the mean of three hour interval ap
indices: 6.4).
Three hour interval K indices: 11112223 (planetary), 11123212 (Boulder).
The background x-ray flux is at the class A5 level.
At midnight there were 4 spotted regions on the visible solar disk. The solar flare activity level was very low. No C class events were recorded during the day.
Region 10795 decayed slowly and is rotating over the northwest limb.
Region 10797 developed slowly and may be capable of producing isolated C flares.
Spotted regions not numbered by NOAA/SEC:
[S581] This regions emerged in the southeast quadrant on August 12 to the west of region 10797. Location at midnight:
S10E25.
[S582] A new region rotated into view at the southeast limb on August 12. Location at midnight: S09E78.
The first signs of solar cycle 24 was observed on August 12 when a small bipolar region (with polarities reversed compared to cycle 23 regions) emerged in the northeast quadrant. A couple of tiny spots were observed during the evening, these had decayed to just pores by midnight when the region was spotless. Its location at midnight was N27E28. This observation hints at a solar minimum sometime between April and October in 2006.
August 10-12: No obvious partly or fully Earth directed CMEs were observed.
Coronal hole
history (since late October 2002)
Compare today's report with the situation one solar rotation ago: 28
days ago 27 days ago 26
days ago
A poorly defined trans equatorial coronal (CH180) was in an Earth facing position on August 8-9. Recurrent trans equatorial coronal hole (CH181) will likely rotate to an Earth facing position on August 13-15.

Processed SOHO/EIT 284 image at 13:06 UTC on August 12. The darkest areas on the solar disk are likely coronal holes.
The geomagnetic field is expected to be quiet to active on August 13 and quiet to unsettled on August 14-15. A high speed stream from CH181 is likely to arrive on August 16 and cause unsettled to minor storm conditions until August 18.
| Coronal holes (1) | Coronal mass ejections (2) | M and X class flares (3) |
1) Effects from a coronal hole could reach Earth
within the next 5 days. When the high speed stream has arrived
the color changes to green.
2) Material from a CME is likely to impact Earth within 96 hours.
3) There is a possibility of either M or X class flares within the next
48 hours.
Green: 0-20% probability, Yellow: 20-60% probability, Red: 60-100% probability.
Long distance low and medium frequency (below 2 MHz) propagation along east-west paths over high and upper middle latitudes is very poor. Propagation on long distance northeast-southwest paths is poor. Trans Atlantic propagation conditions are normally monitored every night on 1470 kHz. Dominant stations tonight: Radio Cristal del Uruguay and Radio Vibraci�n (Venezuela) and LT28 Rafaela Argentina. Before 02h UTC some North American stations were audible. While CJYQ on 930 kHz had a good signal, weak signals were heard from WBBR 1130, CBI on 1140 and WWZN on 1510 kHz. These stations and several stations from Venezuela and Colombia disappeared when the disturbance arrived. A few, mostly weak, stations from Argentina and Uruguay could be heard after 03h UTC with Radio Monte Carlo on 930 kHz observed with a fair signal.
Compare to the previous day's image.
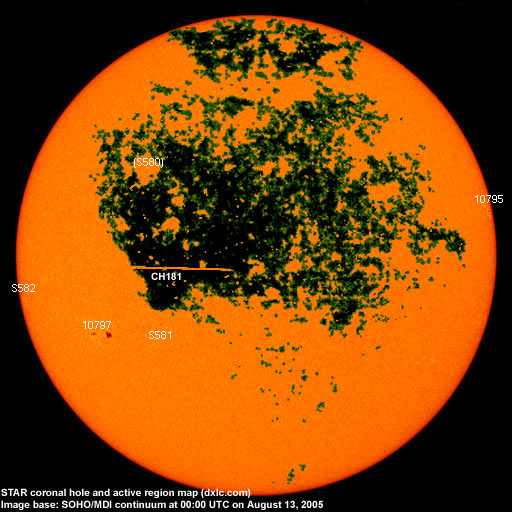
Data for all numbered solar regions according to the Solar Region Summary provided by NOAA/SEC. Comments are my own, as is the STAR spot count (spots observed at or inside a few hours before midnight) and data for regions not numbered by SEC or where SEC has observed no spots. SEC active region numbers in the table below and in the active region map above are the historic SEC/USAF numbers.
| Active region | Date numbered | SEC spot count |
STAR spot count |
Location at midnight | Area | Classification | Comment |
|---|---|---|---|---|---|---|---|
| 10794 | 2005.07.31 | 1 | S14W89 | 0120 | HAX | rotated out of view | |
| 10795 | 2005.07.31 | 4 | 1 | N10W79 | 0030 | CRO |
classification was HRX at midnight, area 0010 location: N12W80 |
| 10797 | 2005.08.11 | 12 | 14 | S13E42 | 0060 | DSO | classification was DAI at midnight |
| S578 | 2005.08.09 | N05W56 | |||||
| S580 | 2005.08.12 | N27E28 | spotless at midnight, first cycle 24 region | ||||
| S581 | 2005.08.12 | 2 | S10E25 | 0010 | AXX | ||
| S582 | 2005.08.12 | 1 | S09E78 | 0010 | AXX | ||
| Total spot count: | 17 | 18 | |||||
| SSN: | 47 | 58 | |||||
| Month | Average solar flux at Earth |
International sunspot number | Smoothed sunspot number |
|---|---|---|---|
| 2000.04 | 184.2 | 125.5 | 120.8 cycle 23 sunspot max. |
| 2000.07 | 202.3 | 170.1 | 119.8 |
| 2001.12 | 235.1 | 132.2 | 114.6 (-0.9) |
| 2004.06 | 97.4 | 43.2 | 41.6 (-2.2) |
| 2004.07 | 119.1 | 51.1 | 40.2 (-1.4) |
| 2004.08 | 109.6 | 40.9 | 39.2 (-1.0) |
| 2004.09 | 103.1 | 27.7 | 37.5 (-1.7) |
| 2004.10 | 105.9 | 48.0 | 35.9 (-1.6) |
| 2004.11 | 113.2 | 43.5 | 35.3 (-0.6) |
| 2004.12 | 94.5 | 17.9 | 35.2 (-0.1) |
| 2005.01 | 102.2 | 31.3 | 34.6 (-0.6) |
| 2005.02 | 97.2 | 29.2 | (33.5 predicted, -1.1) |
| 2005.03 | 89.9 | 24.5 | (32.1 predicted, -1.4) |
| 2005.04 | 86.0 | 24.4 | (30.2 predicted, -1.9) |
| 2005.05 | 99.3 | 42.6 | (27.6 predicted, -2.6) |
| 2005.06 | 93.7 | 39.6 | (26.1 predicted, -1.5) |
| 2005.07 | 96.4 | 39.9 | (25.1 predicted, -1.0) |
| 2005.08 | 93.2 (1) | 26.4 (2) | (23.2 predicted, -1.9) |
1) Running average based on the daily 20:00 UTC observed solar flux
value at 2800 MHz.
2) Unofficial, accumulated value based on the Boulder (NOAA/SEC)
sunspot number. The official international sunspot number is typically
30-50% lower.
This report has been prepared by Jan Alvestad. It is based partly on my own observations and analysis, and partly on data from some of these solar data sources. All time references are to the UTC day. Comments and suggestions are always welcome.
| [DX-Listeners' Club] |