
Last major update issued on August 15, 2005 at 04:45 UTC.
[Solar and
geomagnetic data - last month (updated daily)]
[Solar wind and
electron fluence charts (updated daily)]
[Solar cycles 21-23
(last update August 2, 2005)]
[Solar cycles 1-20]
[Graphical comparison
of cycles 21, 22 and 23 (last update August 2, 2005)]
[Graphical
comparison of cycles 2, 10, 13, 17, 20 and 23 (last update August 2, 2005)]
[Historical solar and
geomagnetic data charts 1954-2004 (last update February 1, 2005)]
[Archived reports
(last update August 13, 2005)]
The geomagnetic field was quiet to active on August 14. Solar wind speed ranged between 377 and 554 (all day average 461) km/sec, generally decreasing all day.
Solar flux measured at 20h UTC on 2.8 GHz was 74.8. The planetary
A
index was 10 (STAR Ap - based on the mean of three hour interval ap
indices: 10.5).
Three hour interval K indices: 44222222 (planetary), 34212222 (Boulder).
The background x-ray flux is at the class A4 level.
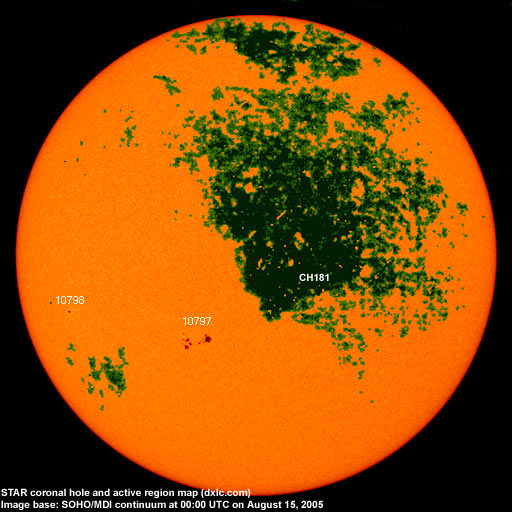
At midnight there were 2 spotted regions on the visible solar disk. The solar flare activity level was very low. No C class events were recorded during the day.
Region 10797 decayed in the leading spot section while slow development was observed in the trailing spots. C flares are
possible.
New region 10798 rotated into view at the southeast limb on August 12 and was noticed by SEC two days later. Slow
development was observed on August 14.
August 12-14: No obvious partly or fully Earth directed CMEs were observed.
Coronal hole
history (since late October 2002)
Compare today's report with the situation one solar rotation ago: 28
days ago 27 days ago 26
days ago
Recurrent trans equatorial coronal hole (CH181) was in an Earth facing position on August 13-15.

Processed SOHO/EIT 284 image at 01:06 UTC on August 15. The darkest areas on the solar disk are likely coronal holes.
The geomagnetic field is expected to be quiet on August 15. A high speed stream from CH181 is likely to arrive on August 16 and cause unsettled to minor storm conditions until August 18.
| Coronal holes (1) | Coronal mass ejections (2) | M and X class flares (3) |
1) Effects from a coronal hole could reach Earth
within the next 5 days. When the high speed stream has arrived
the color changes to green.
2) Material from a CME is likely to impact Earth within 96 hours.
3) There is a possibility of either M or X class flares within the next
48 hours.
Green: 0-20% probability, Yellow: 20-60% probability, Red: 60-100% probability.
Long distance low and medium frequency (below 2 MHz) propagation along east-west paths over high and upper middle latitudes is fair to good. Propagation on long distance northeast-southwest paths is poor. Trans Atlantic propagation conditions are normally monitored every night on 1470 kHz. Dominant stations tonight: Radio Vibraci�n (Venezuela). Radio Cristal del Uruguay was audible at times. Stations from the easternmost parts of the US and Canada were audible on many frequencies throughout the MW band. The NY stations on 880, 1010, 1050, 1130, 1520 and 1560 had particularly good signals. CHGM good on 1150 with a couple of UNIDs observed on 1160 kHz. Cuba was noted on 620, 670, 840 and 890 kHz.
Compare to the previous day's image.
Data for all numbered solar regions according to the Solar Region Summary provided by NOAA/SEC. Comments are my own, as is the STAR spot count (spots observed at or inside a few hours before midnight) and data for regions not numbered by SEC or where SEC has observed no spots. SEC active region numbers in the table below and in the active region map above are the historic SEC/USAF numbers.
| Active region | Date numbered | SEC spot count |
STAR spot count |
Location at midnight | Area | Classification | Comment |
|---|---|---|---|---|---|---|---|
| 10797 | 2005.08.11 | 13 | 23 | S13E16 | 0180 | DAI | location: S14E14 |
| 10798 | 2005.08.14 | 1 | 2 | 0010 | HRX |
formerly region S582 location: S09E51 |
|
| S578 | 2005.08.09 | N05W82 | |||||
| S580 | 2005.08.12 | N27E02 | first cycle 24 region | ||||
| S581 | 2005.08.12 | S10W01 | plage | ||||
| Total spot count: | 14 | 25 | |||||
| SSN: | 34 | 45 | |||||
| Month | Average solar flux at Earth |
International sunspot number | Smoothed sunspot number |
|---|---|---|---|
| 2000.04 | 184.2 | 125.5 | 120.8 cycle 23 sunspot max. |
| 2000.07 | 202.3 | 170.1 | 119.8 |
| 2001.12 | 235.1 | 132.2 | 114.6 (-0.9) |
| 2004.06 | 97.4 | 43.2 | 41.6 (-2.2) |
| 2004.07 | 119.1 | 51.1 | 40.2 (-1.4) |
| 2004.08 | 109.6 | 40.9 | 39.2 (-1.0) |
| 2004.09 | 103.1 | 27.7 | 37.5 (-1.7) |
| 2004.10 | 105.9 | 48.0 | 35.9 (-1.6) |
| 2004.11 | 113.2 | 43.5 | 35.3 (-0.6) |
| 2004.12 | 94.5 | 17.9 | 35.2 (-0.1) |
| 2005.01 | 102.2 | 31.3 | 34.6 (-0.6) |
| 2005.02 | 97.2 | 29.2 | (33.5 predicted, -1.1) |
| 2005.03 | 89.9 | 24.5 | (32.1 predicted, -1.4) |
| 2005.04 | 86.0 | 24.4 | (30.2 predicted, -1.9) |
| 2005.05 | 99.3 | 42.6 | (27.6 predicted, -2.6) |
| 2005.06 | 93.7 | 39.6 | (26.1 predicted, -1.5) |
| 2005.07 | 96.4 | 39.9 | (25.1 predicted, -1.0) |
| 2005.08 | 90.6 (1) | 28.6 (2) | (23.2 predicted, -1.9) |
1) Running average based on the daily 20:00 UTC observed solar flux
value at 2800 MHz.
2) Unofficial, accumulated value based on the Boulder (NOAA/SEC)
sunspot number. The official international sunspot number is typically
30-50% lower.
This report has been prepared by Jan Alvestad. It is based partly on my own observations and analysis, and partly on data from some of these solar data sources. All time references are to the UTC day. Comments and suggestions are always welcome.
| [DX-Listeners' Club] |