
Last major update issued on August 23, 2005 at 04:25 UTC.
[Solar and
geomagnetic data - last month (updated daily)]
[Solar wind and
electron fluence charts (updated daily)]
[Solar cycles 21-23
(last update August 2, 2005)]
[Solar cycles 1-20]
[Graphical comparison
of cycles 21, 22 and 23 (last update August 2, 2005)]
[Graphical
comparison of cycles 2, 10, 13, 17, 20 and 23 (last update August 2, 2005)]
[Historical solar and
geomagnetic data charts 1954-2004 (last update February 1, 2005)]
[Archived reports
(last update August 13, 2005)]
The geomagnetic field was quiet to active on August 22. Solar wind speed ranged between 441 and 588 (all day average 522) km/sec under the influence of a high speed stream from CH182.
Solar flux measured at 23h UTC on 2.8 GHz was 104.9 (the reading at 20h UTC was too high because of the major flare). The planetary
A
index was 12 (STAR Ap - based on the mean of three hour interval ap
indices: 11.8).
Three hour interval K indices: 34122333 (planetary), 22222431 (Boulder).
The background x-ray flux is at the class B2 level.
At midnight there were 2 spotted regions on the visible solar disk. The solar flare activity level was high. A total of 2 M class events was recorded during the day.
Region 10800 developed further. A central penumbra contains both positive and negative polarity spots. C flares are possible and there is a chance of a minor M class flare.
Spotted regions not numbered or wrongly numbered by NOAA/SEC:
[S583] This is a complex, compact reversed polarity region. Almost all spots are within a single large penumbra. This
penumbra has a strong magnetic delta structure with the positive polarity area in the northwest spearheading the negative polarity
area. Further M or even X class proton flares are possible. Location at midnight: S10W63. Flares:
M2.6/1N long duration proton event peaking at 01:50 (associated with strong type II and IV radio sweeps and a full halo CME) and a
major long duration M5.6/1N proton event peaking at 17:27 UTC. The latter event was associated with a strong type IV radio sweep
and a large CME.
Early on August 23 the above 10 MeV proton flux has peaked near 300 pfu. Higher levels are possible when the CMEs associated with the flares reach Earth on August 24 and 25.
August 20-21: No obvious partly or fully Earth directed CMEs were observed.
August 22: A complex CME event was observed after the M2.6 LDE early in the day. While most of the CME was observed over
the southwest limb, contributions from disappearing filaments to the east of flare source made this a full halo CME. It's actually
hard to tell if this CME should be separated into 2 or 3 different CMEs, all occurring within a short time period. A large CME was
observed over the southwest limb following the major LDE event during the afternoon. Extensions over the eastern hemisphere were
much weaker, however, it is still likely that Earth will receive some effects even from this CME.
Coronal hole
history (since late October 2002)
Compare today's report with the situation one solar rotation ago: 28
days ago 27 days ago 26
days ago
A recurrent coronal hole (CH183) in the southern hemisphere was in an Earth facing position on August 21-22. CH183 doubled its size after the M2 LDE early on August 22.
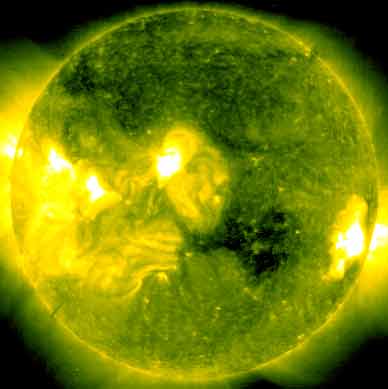
Processed SOHO/EIT 284 image at 19:06 UTC on August 22. The darkest areas on the solar disk are likely coronal holes.
The geomagnetic field is expected to be quiet to unsettled on August 23. The CME associated with the M2 event in region S583 early on Aug.22 is likely to reach Earth early on August 24 and cause active to major storm conditions. This could become a complex disturbance due to possible interaction between this CME and a high speed stream from CH183. Another CME, this time from the major LDE during the afternoon on Aug.22 could arrive late on August 24 or early on August 25 and cause unsettled to major storm conditions.
| Coronal holes (1) | Coronal mass ejections (2) | M and X class flares (3) |
 |
|
|
1) Effects from a coronal hole could reach Earth
within the next 5 days. When the high speed stream has arrived
the color changes to green.
2) Material from a CME is likely to impact Earth within 96 hours.
3) There is a possibility of either M or X class flares within the next
48 hours.
Green: 0-20% probability, Yellow: 20-60% probability, Red: 60-100% probability.
Long distance low and medium frequency (below 2 MHz) propagation along east-west paths over high and upper middle latitudes is poor. Propagation on long distance northeast-southwest paths is fair to poor. Trans Atlantic propagation conditions are normally monitored every night on 1470 kHz. Dominant stations tonight: Radio Cristal del Uruguay and Radio Vibración (Venezuela). Most of the usual stations from the Canadian Atlantic provinces were audible with weak to fair signals while only a few stations from the USA could be heard. Buenos Aires stations had fair signals on 950, 1110, 1190 and 1350 kHz.
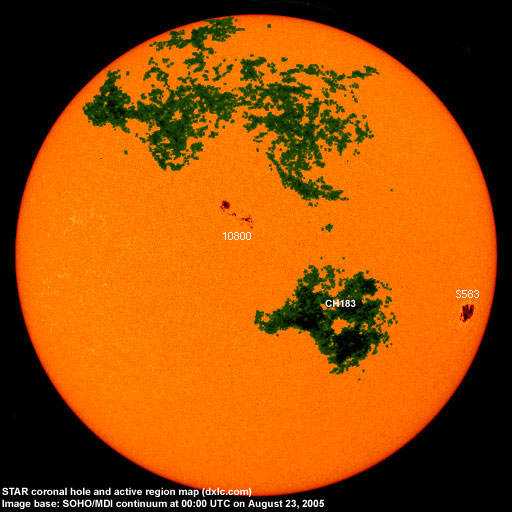
Compare to the previous day's image.
Data for all numbered solar regions according to the Solar Region Summary provided by NOAA/SEC. Comments are my own, as is the STAR spot count (spots observed at or inside a few hours before midnight) and data for regions not numbered by SEC or where SEC has observed no spots. SEC active region numbers in the table below and in the active region map above are the historic SEC/USAF numbers.
| Active region | Date numbered | SEC spot count |
STAR spot count |
Location at midnight | Area | Classification | Comment |
|---|---|---|---|---|---|---|---|
| 10797 | 2005.08.11 | 1 | S13W90 | 0060 | HAX | rotated out of view | |
| 10798 | 2005.08.14 | 15 | S11W62 | 0670 | DKC |
spotless SEC has included nearby region S583 in this region location: S09W55 |
|
| 10800 | 2005.08.19 | 28 | 32 | N17E06 | 0130 | DAI | area was 0220 at midnight |
| 10801 | 2005.08.20 | 1 | N08E33 | 0000 | AXX | spotless, location N08E23 | |
| S583 | 2005.08.18 | 28 | S10W63 | 0700 | DKC |
beta-delta reversed polarity region |
|
| Total spot count: | 45 | 60 | |||||
| SSN: | 85 | 80 | |||||
| Month | Average solar flux at Earth |
International sunspot number | Smoothed sunspot number |
|---|---|---|---|
| 2000.04 | 184.2 | 125.5 | 120.8 cycle 23 sunspot max. |
| 2000.07 | 202.3 | 170.1 | 119.8 |
| 2001.12 | 235.1 | 132.2 | 114.6 (-0.9) |
| 2004.06 | 97.4 | 43.2 | 41.6 (-2.2) |
| 2004.07 | 119.1 | 51.1 | 40.2 (-1.4) |
| 2004.08 | 109.6 | 40.9 | 39.2 (-1.0) |
| 2004.09 | 103.1 | 27.7 | 37.5 (-1.7) |
| 2004.10 | 105.9 | 48.0 | 35.9 (-1.6) |
| 2004.11 | 113.2 | 43.5 | 35.3 (-0.6) |
| 2004.12 | 94.5 | 17.9 | 35.2 (-0.1) |
| 2005.01 | 102.2 | 31.3 | 34.6 (-0.6) |
| 2005.02 | 97.2 | 29.2 | (33.5 predicted, -1.1) |
| 2005.03 | 89.9 | 24.5 | (32.1 predicted, -1.4) |
| 2005.04 | 86.0 | 24.4 | (30.2 predicted, -1.9) |
| 2005.05 | 99.3 | 42.6 | (27.6 predicted, -2.6) |
| 2005.06 | 93.7 | 39.6 | (26.1 predicted, -1.5) |
| 2005.07 | 96.4 | 39.9 | (25.1 predicted, -1.0) |
| 2005.08 | 89.7 (1) | 44.0 (2) | (23.2 predicted, -1.9) |
1) Running average based on the daily 20:00 UTC observed solar flux
value at 2800 MHz.
2) Unofficial, accumulated value based on the Boulder (NOAA/SEC)
sunspot number. The official international sunspot number is typically
30-50% lower.
This report has been prepared by Jan Alvestad. It is based partly on my own observations and analysis, and partly on data from some of these solar data sources. All time references are to the UTC day. Comments and suggestions are always welcome.
| [DX-Listeners' Club] |