
Last major update issued on January 8, 2005 at 04:40 UTC.
[Solar and geomagnetic data - last month (updated daily)]
[Solar wind and electron fluence charts (updated daily)]
[Solar cycles 21-23 (last update January 2, 2005)]
[Solar cycles 1-20]
[Graphical comparison of cycles 21, 22 and 23 (last update January 2, 2005)]
[Graphical comparison of cycles 2, 10, 13, 17, 20 and 23 (last update January
2, 2005)]
[Historical solar and geomagnetic data charts 1954-2004 (last update November 8,
2004)]
[Archived reports (last update January 2, 2005)]
The geomagnetic field was inactive to severe storm on January 7. Solar wind speed ranged between 476 and 690 km/sec. The first part of a strong CME disturbance arrived at ACE at 08:40 UTC. There was a small but noticeable sudden increase in the total field of the interplanetary magnetic field, in solar wind density and speed. While this CME did not look very impressive early on, this view changed quickly as the total field of the IMF gradually strengthened. The IMF swung strongly southwards 13:30 to 15:00 UTC and very strongly southwards 21:00 to 23:30 UTC. These two episodes caused major to severe geomagnetic storming. The source of this disturbance is likely the full halo CME observed on January 5.
Solar flux measured at 20h UTC on 2.8 GHz was 83.5. The planetary A
index was 37 (STAR Ap - based on the mean of three hour interval ap indices: 37.3).
Three hour interval K indices: 10016647 (planetary), 10016637 (Boulder).
The background x-ray flux is at the class A9 level.
At midnight there was 1 spotted region on the visible solar disk. The solar flare activity level was very low. No C class events were recorded during the day.
New region 10718 rotated into view at the southeast limb. C flares are possible.
January 6-7: No obvious fully or partly Earth directed CMEs were observed.
January 5: Two CMEs of interest were observed during the day. The first was a very faint partial halo CME where most of the
ejected material was observed over the west limbs. Its source was probably a filament eruption (associated with a B class long
duration x-ray event) near region 10715. This event occurred approximately between 04 and 06h UTC. The second CME is more
interesting as it was more obvious, full halo, and likely has a larger potential for causing a geomagnetic disturbance. Its source
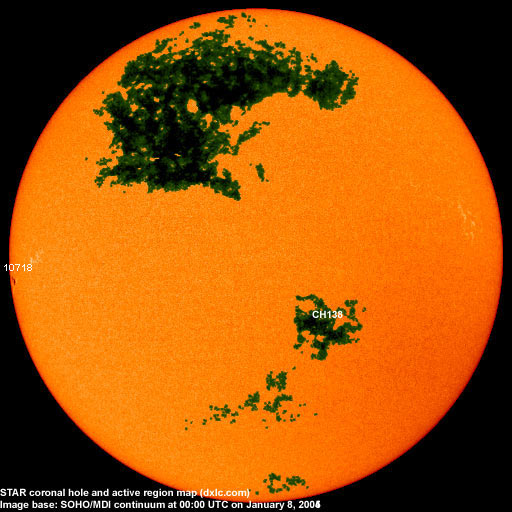
was a fairly large filament eruption in the northeast quadrant near 14h UTC. The coronal hole image below outlines the filament as
it is about to erupt, the shape of the filament is an elongated number 2.
Coronal hole history (since late October 2002)
Compare today's report with the situation one solar rotation ago: 28
days ago 27 days ago 26 days ago
A recurrent coronal hole in the southern hemisphere was likely in a geoeffective position on January 6-7. The associated high speed stream could become geoeffective on January 9 or 10.
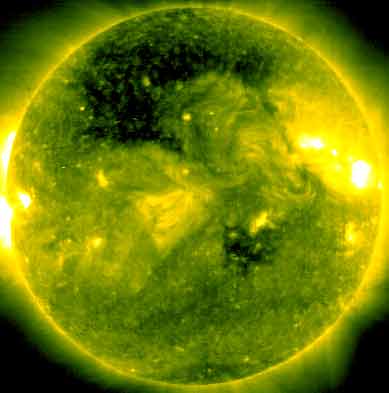
Processed SOHO/EIT 284 image at 01:06 UTC on January 8. The darkest areas on the solar disk are likely coronal holes.
The geomagnetic field is expected to be quiet to major storm on January 8 due to CME effects and quiet to active on January 9-10 due to weak coronal hole effects.
| Coronal holes (1) | Coronal mass ejections (2) | M and X class flares (3) |
1) Effects from a coronal hole could reach Earth within the next 5 days. When the high speed stream has arrived
the color changes to green.
2) Material from a CME is likely to impact Earth within 96 hours.
3) There is a possibility of either M or X class flares within the next 48 hours.
Green: 0-20% probability, Yellow: 20-60% probability, Red: 60-100% probability.
Long distance low and medium frequency (below 2 MHz) propagation along east-west paths over high and upper middle latitudes is very poor. Propagation along long distance north-south paths is fair. Trans Atlantic propagation conditions are normally monitored every night on 1470 kHz. Dominant station tonight: Radio Cristal del Uruguay (presumed) with a weak signal. From North America only 3 stations were noted, WWZN on 1510 (weak signal), WWRU on 1660 and surprisingly KVNS on 1700 kHz. The best trans Atlantic signals were noted on 930 (from R�dio Metropolitana and CBN) and 740 kHz (R�dio Sociedade), all Brazil.
Compare to the previous day's image.
Data for all numbered solar regions according to the Solar Region Summary provided by NOAA/SEC. Comments are my own, as is the STAR spot count (spots observed at or inside a few hours before midnight) and data for regions not numbered by SEC or where SEC has observed no spots. SEC active region numbers in the table below and in the active region map above are the historic SEC/USAF numbers.
| Active region | Date numbered | SEC spot count |
STAR spot count |
Location at midnight | Area | Classification | Comment |
|---|---|---|---|---|---|---|---|
| 10715 | 2004.12.28 | 1 | N06W59 | 0020 | HAX | spotless | |
| 10716 | 2004.12.30 | S13W55 | plage | ||||
| 10718 | 2005.01.07 | 1 | 3 | S09E78 | 0060 | HAX |
classification was CAO at midnight, area 0100 |
| S493 | emerged on 2005.01.06 |
S16E33 | plage | ||||
| Total spot count: | 2 | 3 | |||||
| SSN: | 22 | 13 | |||||
| Month | Average solar flux at Earth |
International sunspot number | Smoothed sunspot number |
|---|---|---|---|
| 2000.04 | 184.2 | 125.5 | 120.8 cycle 23 sunspot max. |
| 2000.07 | 202.3 | 170.1 | 119.8 |
| 2001.12 | 235.1 | 132.2 | 114.6 (-0.9) |
| 2003.11 | 140.8 | 67.3 | 56.7 (-1.5) |
| 2003.12 | 114.9 | 46.5 | 54.8 (-1.9) |
| 2004.01 | 114.1 | 37.3 | 52.0 (-2.8) |
| 2004.02 | 107.0 | 45.8 | 49.3 (-2.7) |
| 2004.03 | 112.0 | 49.1 | 47.1 (-2.2) |
| 2004.04 | 101.2 | 39.3 | 45.5 (-1.6) |
| 2004.05 | 99.8 | 41.5 | 43.9 (-1.6) |
| 2004.06 | 97.4 | 43.2 | 41.7 (-2.2) |
| 2004.07 | 119.1 | 51.0 | (39.6 predicted, -1.9) |
| 2004.08 | 109.6 | 40.9 | (38.0 predicted, -1.6) |
| 2004.09 | 103.1 | 27.7 | (36.1 predicted, -1.9) |
| 2004.10 | 105.9 | 48.4 | (33.9 predicted, -2.2) |
| 2004.11 | 113.2 | 43.7 | (32.0 predicted, -1.9) |
| 2004.12 | 94.5 | 17.9 | (29.7 predicted, -2.3) |
| 2005.01 | 90.9 (1) | 7.3 (2) | (27.0 predicted, -2.7) |
1) Running average based on the daily 20:00 UTC observed solar flux value at 2800 MHz.
2) Unofficial, accumulated value based on the Boulder (NOAA/SEC) sunspot number. The official international sunspot number is typically
30-50% less.
This report has been prepared by Jan Alvestad. It is based partly on my own observations and analysis, and partly on data from some of these solar data sources. All time references are to the UTC day. Comments and suggestions are always welcome.
| [DX-Listeners' Club] |