
Last major update issued on July 4, 2005 at 04:30 UTC.
[Solar and
geomagnetic data - last month (updated daily)]
[Solar wind and
electron fluence charts (updated daily)]
[Solar cycles 21-23
(last update July 2, 2005)]
[Solar cycles 1-20]
[Graphical comparison
of cycles 21, 22 and 23 (last update July 2, 2005)]
[Graphical
comparison of cycles 2, 10, 13, 17, 20 and 23 (last update July 2, 2005)]
[Historical solar and
geomagnetic data charts 1954-2004 (last update February 1, 2005)]
[Archived reports
(last update July 2, 2005)]
The geomagnetic field was quiet to active on July 3. Solar wind speed ranged between 466 and 564 (all day average 516) km/sec under the slowly decreasing influence of a high speed stream from CH173.
Solar flux measured at 20h UTC on 2.8 GHz was 129.8. The planetary
A
index was 11 (STAR Ap - based on the mean of three hour interval ap
indices: 11.3).
Three hour interval K indices: 43233222 (planetary), 42223322 (Boulder).
The background x-ray flux is at the class B3 level.
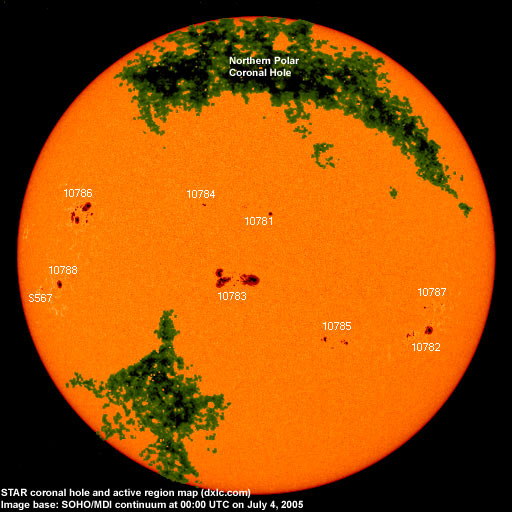
At midnight there were 9 spotted regions on the visible solar disk. The solar flare activity level was low. A total of 4 C class events was recorded during the day.
Region 10781 added a few small trailing spots and was quiet.
Region 10782 decayed further. Flares: C1.6 at 09:55 and C1.0 at 12:27 UTC.
Region 10783 added some penumbral area. The region appears to have lost some complexity with the main opposite polarity
areas are drifting apart. There is a minor chance of an M class flare.
Region 10784 decayed slowly and quietly.
Region 10785 decayed significantly and was quiet.
Region 10786 developed slowly and remained complex with a magnetic delta structure in the northernmost penumbra. An M class flare is possible.
Region 10787 decayed slowly. Flares: C4.7 at 04:56 and C1.2 at 21:11 UTC.
Region 10788 was quiet and stable.
Spotted regions not numbered by NOAA/SEC:
[S567] This region emerged emerged to the east southeast of region 10788 on July 3. Location at midnight: S07E63.
July 1-3: No obvious fully or partly Earth directed CMEs were observed in available LASCO images.
Coronal hole
history (since late October 2002)
Compare today's report with the situation one solar rotation ago: 28
days ago 27 days ago 26
days ago
An extension of a coronal hole in the southern hemisphere could rotate into an Earth facing position on July 5-6.

Processed SOHO/EIT 284 image at 01:06 UTC on July 4. The darkest areas on the solar disk are likely coronal holes.
The geomagnetic field is expected to be quiet to unsettled on July 4-7 with the chance of an isolated active interval on July 4.
| Coronal holes (1) | Coronal mass ejections (2) | M and X class flares (3) |
1) Effects from a coronal hole could reach Earth
within the next 5 days. When the high speed stream has arrived
the color changes to green.
2) Material from a CME is likely to impact Earth within 96 hours.
3) There is a possibility of either M or X class flares within the next
48 hours.
Green: 0-20% probability, Yellow: 20-60% probability, Red: 60-100% probability.
Long distance low and medium frequency (below 2 MHz) propagation along east-west paths over high and upper middle latitudes is poor. Propagation along long distance north-south paths is fair. Trans Atlantic propagation conditions are normally monitored every night on 1470 kHz. Dominant station tonight: Radio Cristal del Uruguay with a good signal. On other frequencies Radio Am�rica (Argentina) on 1190 had an unusually clear signal. The only North American station noted was CJYQ on 930 kHz with a poor to fair signal. Unfortunately thunderstorm activity over France made listening to the weakest stations very difficult.
Compare to the previous day's image.
Data for all numbered solar regions according to the Solar Region Summary provided by NOAA/SEC. Comments are my own, as is the STAR spot count (spots observed at or inside a few hours before midnight) and data for regions not numbered by SEC or where SEC has observed no spots. SEC active region numbers in the table below and in the active region map above are the historic SEC/USAF numbers.
| Active region | Date numbered | SEC spot count |
STAR spot count |
Location at midnight | Area | Classification | Comment |
|---|---|---|---|---|---|---|---|
| 10781 | 2005.06.27 | 2 | 4 | N13W03 | 0030 | HSX | classification was CSO at midnight, location: N14W01 |
| 10782 | 2005.06.29 | 14 | 14 | S17W45 | 0230 | DAO | area was 0150 at midnight |
| 10783 | 2005.06.29 | 31 | 31 | S03E04 | 0600 | EKC | area was 0750 at midnight |
| 10784 | 2005.06.29 | 4 | 3 | N16E14 | 0020 | CSO | classification was CAO at midnight, location: N16E30 |
| 10785 | 2005.06.30 | 12 | 14 | S18W20 | 0130 | DAI | area was 0070 at midnight |
| 10786 | 2005.07.01 | 26 | 26 | N12E48 | 0310 | DAI |
beta-gamma-delta classification was DKI at midnight |
| 10787 | 2005.07.01 | 7 | 7 | S10W48 | 0040 | DRO | area was 0020 at midnight |
| 10788 | 2005.07.02 | 3 | 1 | S05E58 | 0100 | CAO | classification was HSX at midnight, location: S05E55 |
| S563 | 2005.06.27 | N10W30 | plage | ||||
| S567 | 2005.07.03 | 2 | S07E63 | 0010 | HRX | ||
| Total spot count: | 99 | 102 | |||||
| SSN: | 179 | 192 | |||||
| Month | Average solar flux at Earth |
International sunspot number | Smoothed sunspot number |
|---|---|---|---|
| 2000.04 | 184.2 | 125.5 | 120.8 cycle 23 sunspot max. |
| 2000.07 | 202.3 | 170.1 | 119.8 |
| 2001.12 | 235.1 | 132.2 | 114.6 (-0.9) |
| 2004.05 | 99.8 | 41.5 | 43.8 (-1.7) |
| 2004.06 | 97.4 | 43.2 | 41.6 (-2.2) |
| 2004.07 | 119.1 | 51.1 | 40.2 (-1.4) |
| 2004.08 | 109.6 | 40.9 | 39.2 (-1.0) |
| 2004.09 | 103.1 | 27.7 | 37.5 (-1.7) |
| 2004.10 | 105.9 | 48.0 | 35.9 (-1.6) |
| 2004.11 | 113.2 | 43.5 | 35.3 (-0.6) |
| 2004.12 | 94.5 | 17.9 | 35.2 (-0.1) |
| 2005.01 | 102.2 | 31.3 | (34.6 predicted, -0.6) |
| 2005.02 | 97.2 | 29.1 | (33.3 predicted, -1.3) |
| 2005.03 | 89.9 | 24.8 | (31.6 predicted, -1.7) |
| 2005.04 | 86.0 | 24.4 | (29.7 predicted, -1.9) |
| 2005.05 | 99.3 | 42.6 | (27.2 predicted, -2.5) |
| 2005.06 | 93.7 | 39.3 | (25.7 predicted, -1.5) |
| 2005.07 | 122.7 (1) | 15.6 (2) | (24.7 predicted, -1.0) |
1) Running average based on the daily 20:00 UTC observed solar flux
value at 2800 MHz.
2) Unofficial, accumulated value based on the Boulder (NOAA/SEC)
sunspot number. The official international sunspot number is typically
30-50% lower.
This report has been prepared by Jan Alvestad. It is based partly on my own observations and analysis, and partly on data from some of these solar data sources. All time references are to the UTC day. Comments and suggestions are always welcome.
| [DX-Listeners' Club] |