
Last major update issued on July 6, 2005 at 04:40 UTC.
[Solar and
geomagnetic data - last month (updated daily)]
[Solar wind and
electron fluence charts (updated daily)]
[Solar cycles 21-23
(last update July 2, 2005)]
[Solar cycles 1-20]
[Graphical comparison
of cycles 21, 22 and 23 (last update July 2, 2005)]
[Graphical
comparison of cycles 2, 10, 13, 17, 20 and 23 (last update July 2, 2005)]
[Historical solar and
geomagnetic data charts 1954-2004 (last update February 1, 2005)]
[Archived reports
(last update July 2, 2005)]
The geomagnetic field was quiet on July 5. Solar wind speed ranged between 376 and 457 (all day average 429) km/sec.
Solar flux measured at 20h UTC on 2.8 GHz was 126.8. The planetary
A
index was 5 (STAR Ap - based on the mean of three hour interval ap
indices: 5.3).
Three hour interval K indices: 11122111 (planetary), 22111121 (Boulder).
The background x-ray flux is at the class B3 level.
At midnight there were 7 spotted regions on the visible solar disk. The solar flare activity level was low. A total of 3 C class events was recorded during the day.
Region 10781 was mostly unchanged and quiet.
Region 10782 decayed slowly and quietly, the region will rotate over the southwest limb today.
Region 10783 decayed further losing spots and penumbral area.
Region 10784 decayed slowly and quietly, this region could become spotless late today or tomorrow.
Region 10786 developed slowly and has at least two magnetic delta structures. An M class flare is possible. Flare:
C1.8 at 01:29 UTC.
Region 10787 lost all spots. Flare: C1.2 at 09:59 UTC.
Region 10788 was mostly quiet and stable. Flare: C1.3 at 15:26 UTC. This event was
associated with an erupting filament to the southwest of the region and a faint full halo CME.
Region 10789 was quiet and stable.
July 3-4: No obvious fully or partly Earth directed CMEs were observed in available LASCO images.
July 5: A faint, possibly full halo, CME was observed beginning at 16:18 UTC in LASCO C3 images when material was first
observed over the southeast limb.
Coronal hole
history (since late October 2002)
Compare today's report with the situation one solar rotation ago: 28
days ago 27 days ago 26
days ago
An extension of a coronal hole (CH174) in the southern hemisphere may have been in an Earth facing position on July 5-6.
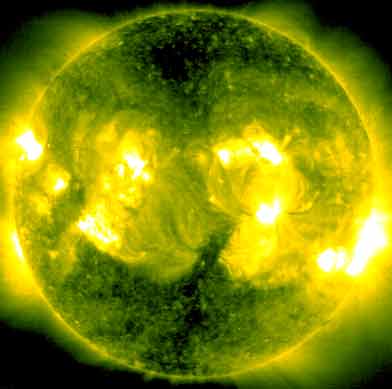
Processed SOHO/EIT 284 image at 01:06 UTC on July 5. The darkest areas on the solar disk are likely coronal holes.
The geomagnetic field is expected to be quiet on July 6-7 becoming quiet to unsettled on July 8-9 due to a weak stream from CH174 and possibly effects from a CME observed on July 5.
| Coronal holes (1) | Coronal mass ejections (2) | M and X class flares (3) |
1) Effects from a coronal hole could reach Earth
within the next 5 days. When the high speed stream has arrived
the color changes to green.
2) Material from a CME is likely to impact Earth within 96 hours.
3) There is a possibility of either M or X class flares within the next
48 hours.
Green: 0-20% probability, Yellow: 20-60% probability, Red: 60-100% probability.
Long distance low and medium frequency (below 2 MHz) propagation along east-west paths over high and upper middle latitudes is poor to fair. Propagation along long distance north-south paths is poor to fair. Trans Atlantic propagation conditions are normally monitored every night on 1470 kHz. Dominant stations tonight: Radio Cristal del Uruguay and CPN Radio (Per�). Stations from Per� were noted on other frequencies as well, some of them interesting splits. One, on 1610.34 kHz, had weak audio as well. From North America 930 CJYQ and 1510 WWZN had the best signals while audio was noted on 1660, 1680 and 1700 kHz as well. 1660 kHz even had WGIT from Puerto Rico at times.
Compare to the previous day's image.
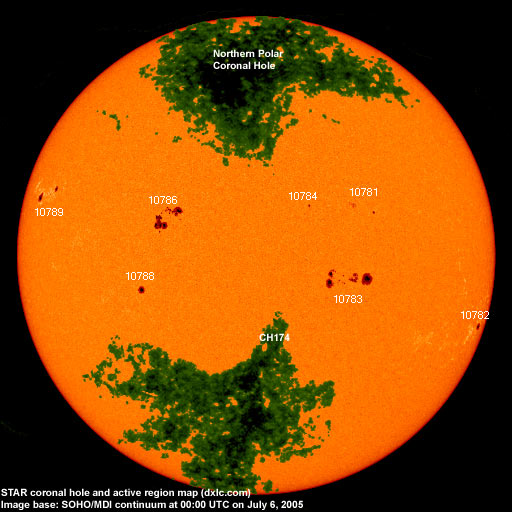
Data for all numbered solar regions according to the Solar Region Summary provided by NOAA/SEC. Comments are my own, as is the STAR spot count (spots observed at or inside a few hours before midnight) and data for regions not numbered by SEC or where SEC has observed no spots. SEC active region numbers in the table below and in the active region map above are the historic SEC/USAF numbers.
| Active region | Date numbered | SEC spot count |
STAR spot count |
Location at midnight | Area | Classification | Comment |
|---|---|---|---|---|---|---|---|
| 10781 | 2005.06.27 | 7 | 9 | N14W26 | 0030 | DSO | |
| 10782 | 2005.06.29 | 7 | 2 | S17W71 | 0100 | DSO | classification was HSX at midnight, location S16W75 |
| 10783 | 2005.06.29 | 37 | 29 | S03W22 | 0530 | EKC | classification was EKI at midnight |
| 10784 | 2005.06.29 | 1 | 1 | N15W13 | 0020 | AXX | classification was HSX at midnight |
| 10785 | 2005.06.30 | 3 | S19W46 | 0020 | BXO | spotless | |
| 10786 | 2005.07.01 | 27 | 26 | N12E23 | 0360 | DAC | beta-gamma-delta |
| 10787 | 2005.07.01 | 2 | S12W71 | 0020 | BXO | spotless | |
| 10788 | 2005.07.02 | 1 | 1 | S06E32 | 0090 | HSX | |
| 10789 | 2005.07.03 | 6 | 7 | N16E66 | 0140 | DSO | classification was DAO at midnight |
| S563 | 2005.06.27 | N10W56 | plage | ||||
| S567 | 2005.07.03 | S07E37 | plage | ||||
| Total spot count: | 91 | 75 | |||||
| SSN: | 181 | 145 | |||||
| Month | Average solar flux at Earth |
International sunspot number | Smoothed sunspot number |
|---|---|---|---|
| 2000.04 | 184.2 | 125.5 | 120.8 cycle 23 sunspot max. |
| 2000.07 | 202.3 | 170.1 | 119.8 |
| 2001.12 | 235.1 | 132.2 | 114.6 (-0.9) |
| 2004.05 | 99.8 | 41.5 | 43.8 (-1.7) |
| 2004.06 | 97.4 | 43.2 | 41.6 (-2.2) |
| 2004.07 | 119.1 | 51.1 | 40.2 (-1.4) |
| 2004.08 | 109.6 | 40.9 | 39.2 (-1.0) |
| 2004.09 | 103.1 | 27.7 | 37.5 (-1.7) |
| 2004.10 | 105.9 | 48.0 | 35.9 (-1.6) |
| 2004.11 | 113.2 | 43.5 | 35.3 (-0.6) |
| 2004.12 | 94.5 | 17.9 | 35.2 (-0.1) |
| 2005.01 | 102.2 | 31.3 | (34.6 predicted, -0.6) |
| 2005.02 | 97.2 | 29.1 | (33.3 predicted, -1.3) |
| 2005.03 | 89.9 | 24.8 | (31.6 predicted, -1.7) |
| 2005.04 | 86.0 | 24.4 | (29.7 predicted, -1.9) |
| 2005.05 | 99.3 | 42.6 | (27.2 predicted, -2.5) |
| 2005.06 | 93.7 | 39.3 | (25.7 predicted, -1.5) |
| 2005.07 | 123.7 (1) | 27.2 (2) | (24.7 predicted, -1.0) |
1) Running average based on the daily 20:00 UTC observed solar flux
value at 2800 MHz.
2) Unofficial, accumulated value based on the Boulder (NOAA/SEC)
sunspot number. The official international sunspot number is typically
30-50% lower.
This report has been prepared by Jan Alvestad. It is based partly on my own observations and analysis, and partly on data from some of these solar data sources. All time references are to the UTC day. Comments and suggestions are always welcome.
| [DX-Listeners' Club] |