
Last major update issued on July 22, 2005 at 04:55 UTC.
[Solar and
geomagnetic data - last month (updated daily)]
[Solar wind and
electron fluence charts (updated daily)]
[Solar cycles 21-23
(last update July 2, 2005)]
[Solar cycles 1-20]
[Graphical comparison
of cycles 21, 22 and 23 (last update July 2, 2005)]
[Graphical
comparison of cycles 2, 10, 13, 17, 20 and 23 (last update July 2, 2005)]
[Historical solar and
geomagnetic data charts 1954-2004 (last update February 1, 2005)]
[Archived reports
(last update July 19, 2005)]
The geomagnetic field was quiet to minor storm on July 21. Solar wind speed ranged between 553 and 674 (all day average 576) km/sec under the influence of a high speed stream from CH175.
Solar flux measured at 20h UTC on 2.8 GHz was 72.8. The planetary
A
index was 29 (STAR Ap - based on the mean of three hour interval ap
indices: 28.6).
Three hour interval K indices: 55452323 (planetary), 55442323 (Boulder).
The background x-ray flux is at the class A1 level.
At midnight the visible solar disk was spotless. The solar flare activity level was very low. No C class events were recorded during the day.
July 19-20: No obvious partly or fully Earth directed CMEs were observed.
July 21: A fast and impressive symmetrical full halo CME was observed in LASCO C3 images beginning at 04:18 UTC. Its
source was on the backside of the Sun, perhaps 6 days behind the northeast limb.
Coronal hole
history (since late October 2002)
Compare today's report with the situation one solar rotation ago: 28
days ago 27 days ago 26
days ago
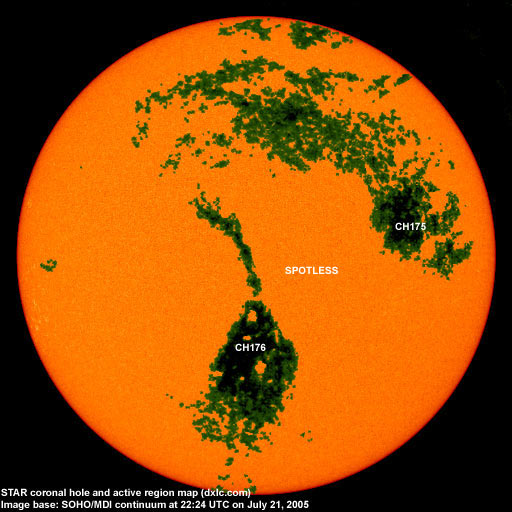
A well defined recurrent trans equatorial coronal hole (CH175) was in an Earth facing position on July 17-19. A recurrent coronal hole (CH176) in the southern hemisphere with a narrow trans equatorial extension will be in an Earth facing position on July 22.
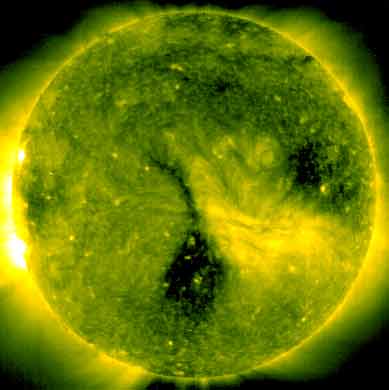
Processed SOHO/EIT 284 image at 01:06 UTC on July 22. The darkest areas on the solar disk are likely coronal holes.
The geomagnetic field is expected to be quiet to unsettled on July 22-25, possibly with isolated active intervals on July 25 due to effects from CH176.
| Coronal holes (1) | Coronal mass ejections (2) | M and X class flares (3) |
1) Effects from a coronal hole could reach Earth
within the next 5 days. When the high speed stream has arrived
the color changes to green.
2) Material from a CME is likely to impact Earth within 96 hours.
3) There is a possibility of either M or X class flares within the next
48 hours.
Green: 0-20% probability, Yellow: 20-60% probability, Red: 60-100% probability.
Long distance low and medium frequency (below 2 MHz) propagation along east-west paths over high and upper middle latitudes is poor to very poor. Propagation on long distance north-south paths was fair before local sunrise and improved to very good during the first hour after local sunrise. Trans Atlantic propagation conditions are normally monitored every night on 1470 kHz. Dominant station tonight: Radio Cristal del Uruguay, however, there were several other stations as well. Most of my listening time was on other frequencies after LSR when stations from Argentina, Uruguay and southern Brazil popped up on many frequencies. Radio Belgrano (Argentina) on 1510 kHz was unusually strong and two stations from Argentina were competing with R�dio Clube Paranaense on 1430 kHz. 1530 kHz, normally dominated by British stations at my location, was difficult to listen to due to a very strong het from 1529.8 kHz. Radio Bahia Blanca (Argentina) on 840 kHz had about the best signal I've ever heard them with. Radio Portales (Chile) was good on 1180 kHz.
Compare to the previous day's image.
Data for all numbered solar regions according to the Solar Region Summary provided by NOAA/SEC. Comments are my own, as is the STAR spot count (spots observed at or inside a few hours before midnight) and data for regions not numbered by SEC or where SEC has observed no spots. SEC active region numbers in the table below and in the active region map above are the historic SEC/USAF numbers.
| Active region | Date numbered | SEC spot count |
STAR spot count |
Location at midnight | Area | Classification | Comment |
|---|---|---|---|---|---|---|---|
| S569 | 2005.07.12 | N06W63 | plage | ||||
| Total spot count: | 0 | 0 | |||||
| SSN: | 0 | 0 | |||||
| Month | Average solar flux at Earth |
International sunspot number | Smoothed sunspot number |
|---|---|---|---|
| 2000.04 | 184.2 | 125.5 | 120.8 cycle 23 sunspot max. |
| 2000.07 | 202.3 | 170.1 | 119.8 |
| 2001.12 | 235.1 | 132.2 | 114.6 (-0.9) |
| 2004.05 | 99.8 | 41.5 | 43.8 (-1.7) |
| 2004.06 | 97.4 | 43.2 | 41.6 (-2.2) |
| 2004.07 | 119.1 | 51.1 | 40.2 (-1.4) |
| 2004.08 | 109.6 | 40.9 | 39.2 (-1.0) |
| 2004.09 | 103.1 | 27.7 | 37.5 (-1.7) |
| 2004.10 | 105.9 | 48.0 | 35.9 (-1.6) |
| 2004.11 | 113.2 | 43.5 | 35.3 (-0.6) |
| 2004.12 | 94.5 | 17.9 | 35.2 (-0.1) |
| 2005.01 | 102.2 | 31.3 | (34.6 predicted, -0.6) |
| 2005.02 | 97.2 | 29.1 | (33.3 predicted, -1.3) |
| 2005.03 | 89.9 | 24.8 | (31.6 predicted, -1.7) |
| 2005.04 | 86.0 | 24.4 | (29.7 predicted, -1.9) |
| 2005.05 | 99.3 | 42.6 | (27.2 predicted, -2.5) |
| 2005.06 | 93.7 | 39.3 | (25.7 predicted, -1.5) |
| 2005.07 | 99.1 (1) | 56.5 (2) | (24.7 predicted, -1.0) |
1) Running average based on the daily 20:00 UTC observed solar flux
value at 2800 MHz.
2) Unofficial, accumulated value based on the Boulder (NOAA/SEC)
sunspot number. The official international sunspot number is typically
30-50% lower.
This report has been prepared by Jan Alvestad. It is based partly on my own observations and analysis, and partly on data from some of these solar data sources. All time references are to the UTC day. Comments and suggestions are always welcome.
| [DX-Listeners' Club] |