
Last major update issued on July 29, 2005 at 05:30 UTC.
[Solar and
geomagnetic data - last month (updated daily)]
[Solar wind and
electron fluence charts (updated daily)]
[Solar cycles 21-23
(last update July 2, 2005)]
[Solar cycles 1-20]
[Graphical comparison
of cycles 21, 22 and 23 (last update July 2, 2005)]
[Graphical
comparison of cycles 2, 10, 13, 17, 20 and 23 (last update July 2, 2005)]
[Historical solar and
geomagnetic data charts 1954-2004 (last update February 1, 2005)]
[Archived reports
(last update July 19, 2005)]
The geomagnetic field was unsettled to minor storm on July 28. Solar wind speed ranged between 378 and 640 (all day average 529) km/sec under the influence of a high speed stream from CH177.
Solar flux measured at 20h UTC on 2.8 GHz was 95.8. The planetary
A
index was 28 (STAR Ap - based on the mean of three hour interval ap
indices: 27.5).
Three hour interval K indices: 35445334 (planetary), 35434324 (Boulder).
The background x-ray flux is at the class B2 level.
At midnight there were 3 spotted regions on the visible solar disk. The solar flare activity level was moderate. A total of 1 C and 2 M class events was recorded during the day.
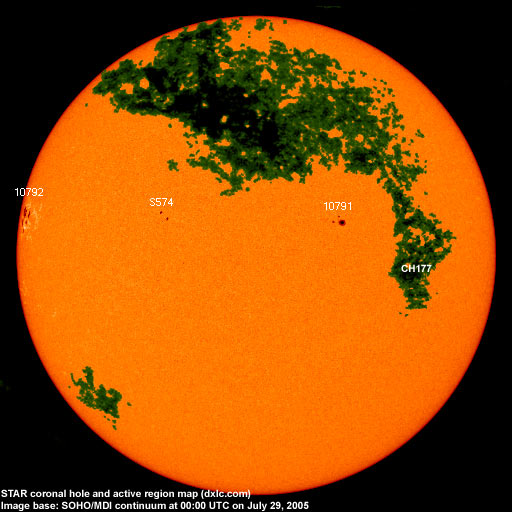
Region 10791 added several trailing spots and was quiet.
New region 10792 rotated into view at the northeast limb. This region is quite complex with at least one significant
magnetic delta structure. A major proton flare is possible, the chance of an X class flare cannot be ignored. Flares:
M1.0 long duration event peaking at 00:30, C2.8 at 06:37 and an M4.8 long duration event peaking at 22:08 UTC. The latter event
was associated with a weak type II radio sweep.
Spotted regions not numbered by NOAA/SEC:
[S574] This region emerged in the northeast quadrant on July 28. Location at midnight: N15E23.
July 26-28: No obvious partly or fully Earth directed CMEs were observed. Several CMEs originating from region 10792 were observed while the region was behind the northeast limb.
Coronal hole
history (since late October 2002)
Compare today's report with the situation one solar rotation ago: 28
days ago 27 days ago 26
days ago
A recurrent trans equatorial coronal hole (CH177) was in an Earth facing position on July 25-27.
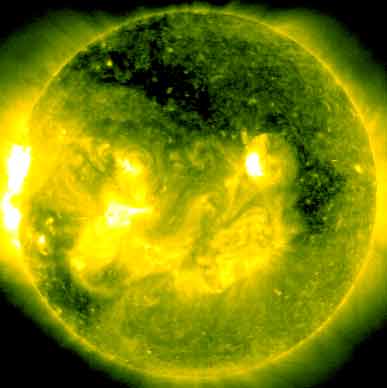
Processed SOHO/EIT 284 image at 01:06 UTC on July 29. The darkest areas on the solar disk are likely coronal holes.
The geomagnetic field is expected to be quiet to minor storm on July 29 and quiet to unsettled on July 30-31.
| Coronal holes (1) | Coronal mass ejections (2) | M and X class flares (3) |
1) Effects from a coronal hole could reach Earth
within the next 5 days. When the high speed stream has arrived
the color changes to green.
2) Material from a CME is likely to impact Earth within 96 hours.
3) There is a possibility of either M or X class flares within the next
48 hours.
Green: 0-20% probability, Yellow: 20-60% probability, Red: 60-100% probability.
Long distance low and medium frequency (below 2 MHz) propagation along east-west paths over high and upper middle latitudes is very poor. Propagation on long distance north-south paths is poor to very poor. Trans Atlantic propagation conditions are normally monitored every night on 1470 kHz. Dominant stations tonight: Radio Cristal del Uruguay and Radio Vibraci�n (Venezuela), both with unusually poor signals. CPN Radio (Per�) was noted just before local sunrise. Weak signals were heard on a few other frequencies with an unidentified station from Brazil on 1590 kHz having the strongest signal.
Compare to the previous day's image.
Data for all numbered solar regions according to the Solar Region Summary provided by NOAA/SEC. Comments are my own, as is the STAR spot count (spots observed at or inside a few hours before midnight) and data for regions not numbered by SEC or where SEC has observed no spots. SEC active region numbers in the table below and in the active region map above are the historic SEC/USAF numbers.
| Active region | Date numbered | SEC spot count |
STAR spot count |
Location at midnight | Area | Classification | Comment |
|---|---|---|---|---|---|---|---|
| 10791 | 2005.07.23 | 2 | 7 | N14W20 | 0120 | HSX | classification was DAO at midnight |
| 10792 | 2005.07.28 | 7 | 28 | N12E78 | 0220 | DSO |
beta-gamma-delta classification was DKC at midnight, area 0600 |
| S573 | 2005.07.23 | N15W71 | plage | ||||
| S574 | 2005.07.28 | 5 | N15E23 | 0040 | DAO | ||
| Total spot count: | 9 | 40 | |||||
| SSN: | 29 | 70 | |||||
| Month | Average solar flux at Earth |
International sunspot number | Smoothed sunspot number |
|---|---|---|---|
| 2000.04 | 184.2 | 125.5 | 120.8 cycle 23 sunspot max. |
| 2000.07 | 202.3 | 170.1 | 119.8 |
| 2001.12 | 235.1 | 132.2 | 114.6 (-0.9) |
| 2004.05 | 99.8 | 41.5 | 43.8 (-1.7) |
| 2004.06 | 97.4 | 43.2 | 41.6 (-2.2) |
| 2004.07 | 119.1 | 51.1 | 40.2 (-1.4) |
| 2004.08 | 109.6 | 40.9 | 39.2 (-1.0) |
| 2004.09 | 103.1 | 27.7 | 37.5 (-1.7) |
| 2004.10 | 105.9 | 48.0 | 35.9 (-1.6) |
| 2004.11 | 113.2 | 43.5 | 35.3 (-0.6) |
| 2004.12 | 94.5 | 17.9 | 35.2 (-0.1) |
| 2005.01 | 102.2 | 31.3 | (34.6 predicted, -0.6) |
| 2005.02 | 97.2 | 29.1 | (33.3 predicted, -1.3) |
| 2005.03 | 89.9 | 24.8 | (31.6 predicted, -1.7) |
| 2005.04 | 86.0 | 24.4 | (29.7 predicted, -1.9) |
| 2005.05 | 99.3 | 42.6 | (27.2 predicted, -2.5) |
| 2005.06 | 93.7 | 39.3 | (25.7 predicted, -1.5) |
| 2005.07 | 95.4 (1) | 60.9 (2) | (24.7 predicted, -1.0) |
1) Running average based on the daily 20:00 UTC observed solar flux
value at 2800 MHz.
2) Unofficial, accumulated value based on the Boulder (NOAA/SEC)
sunspot number. The official international sunspot number is typically
30-50% lower.
This report has been prepared by Jan Alvestad. It is based partly on my own observations and analysis, and partly on data from some of these solar data sources. All time references are to the UTC day. Comments and suggestions are always welcome.
| [DX-Listeners' Club] |