
Last major update issued on June 15, 2005 at 04:05 UTC.
[Solar and
geomagnetic data - last month (updated daily)]
[Solar wind and
electron fluence charts (updated daily)]
[Solar cycles 21-23
(last update June 4, 2005)]
[Solar cycles 1-20]
[Graphical comparison
of cycles 21, 22 and 23 (last update June 4, 2005)]
[Graphical
comparison of cycles 2, 10, 13, 17, 20 and 23 (last update June 4, 2005)]
[Historical solar and
geomagnetic data charts 1954-2004 (last update February 1, 2005)]
[Archived reports
(last update June 4, 2005)]
The geomagnetic field was quiet to active on June 14. Solar wind speed ranged between 421 and 557 km/sec. A fairly weak solar wind shock was observed at ACE near 18:00 UTC when solar wind speed increased abruptly from 450 to 530 km/sec. The source of this shock was likely the faint full halo CME observed early on June 12. Another disturbance began after 01h UTC on June 15 when the high speed stream from CH170 was observed at ACE.
Solar flux measured at 20h UTC on 2.8 GHz was 93.8. The planetary
A
index was 10 (STAR Ap - based on the mean of three hour interval ap
indices: 10.3).
Three hour interval K indices: 22222243 (planetary), 22222233 (Boulder).
The background x-ray flux is at the class B1 level.
At midnight there were 4 spotted regions on the visible solar disk. The solar flare activity level was low. A total of 2 C class events was recorded during the day.
Region 10775 decayed further and has no spots outside of the single penumbra. Flares:
C4.2/1F long duration event peaking at 07:30 (associated with a moderate type IV radio sweep and a full halo CME) and a C7.4 long
duration event peaking at 15:48 UTC.
Region 10776 decayed further and was quiet.
Spotted regions not numbered by NOAA/SEC:
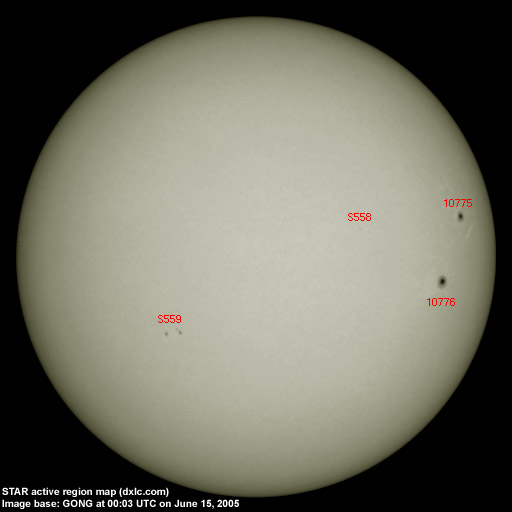
[S558] This region emerged in the northwest quadrant on June 14. Location at midnight: N10W36.
[S559] A new region emerged quickly on June 14 in the southeast quadrant. Location at midnight: S18E22.
June 14: A full halo CME was observed in LASCO images after a long duration C4 event in region 10775 during the morning.
With no available LASCO images covering the C7 long duration event later in the day, it is uncertain if there was another full
halo CME then.
June 13: No obvious fully or partly Earth directed CMEs were observed in LASCO images.
June 12: A faint full halo CME was observed after a very long duration C3.5 event in region 10775 early in the day.
Coronal hole
history (since late October 2002)
Compare today's report with the situation one solar rotation ago: 28
days ago 27 days ago 26
days ago
An elongated coronal hole (CH170) in the northern hemisphere was in an Earth facing position on June 11-13.

Processed SOHO/EIT 284 image at 01:06 UTC on June 6. The darkest areas on the solar disk are likely coronal holes.
The geomagnetic field is expected to be unsettled to minor storm on June 15-16 due to a high speed stream from CH170. The CME observed on June 14 could arrive during the latter half of June 16 or early on June 17 and cause unsettled to major storm conditions.
| Coronal holes (1) | Coronal mass ejections (2) | M and X class flares (3) |
1) Effects from a coronal hole could reach Earth
within the next 5 days. When the high speed stream has arrived
the color changes to green.
2) Material from a CME is likely to impact Earth within 96 hours.
3) There is a possibility of either M or X class flares within the next
48 hours.
Green: 0-20% probability, Yellow: 20-60% probability, Red: 60-100% probability.
Long distance low and medium frequency (below 2 MHz) propagation along east-west paths over high and upper middle latitudes is very poor. Propagation along long distance north-south paths is fair. Trans Atlantic propagation conditions are normally monitored every night on 1470 kHz. Dominant station tonight: Radio Cristal del Uruguay and Radio Rafaela (Argentina). On other frequencies several stations from Brazil and Uruguay were heard. R�dio Metropolitana on 930 and R�dio Cristal on 1350 kHz both had impressive signals.
Compare to the previous day's image.
Data for all numbered solar regions according to the Solar Region Summary provided by NOAA/SEC. Comments are my own, as is the STAR spot count (spots observed at or inside a few hours before midnight) and data for regions not numbered by SEC or where SEC has observed no spots. SEC active region numbers in the table below and in the active region map above are the historic SEC/USAF numbers.
| Active region | Date numbered | SEC spot count |
STAR spot count |
Location at midnight | Area | Classification | Comment |
|---|---|---|---|---|---|---|---|
| 10775 | 2005.06.04 | 7 | 1 | N09W59 | 0200 | DAO | classification was HAX at midnight |
| 10776 | 2005.06.05 | 17 | 1 | S06W48 | 0360 | DKI | classification was HHX at midnight |
| 10777 | 2005.06.10 | N05E02 | plage | ||||
| S556 | 2005.06.09 | N05W60 | plage | ||||
| S558 | 2005.06.14 | 2 | N10W36 | 0010 | BXO | ||
| S559 | 2005.06.14 | 4 | S18E22 | 0070 | DAO | ||
| Total spot count: | 24 | 8 | |||||
| SSN: | 44 | 48 | |||||
| Month | Average solar flux at Earth |
International sunspot number | Smoothed sunspot number |
|---|---|---|---|
| 2000.04 | 184.2 | 125.5 | 120.8 cycle 23 sunspot max. |
| 2000.07 | 202.3 | 170.1 | 119.8 |
| 2001.12 | 235.1 | 132.2 | 114.6 (-0.9) |
| 2004.04 | 101.2 | 39.3 | 45.5 (-1.6) |
| 2004.05 | 99.8 | 41.5 | 43.8 (-1.7) |
| 2004.06 | 97.4 | 43.2 | 41.6 (-2.2) |
| 2004.07 | 119.1 | 51.1 | 40.2 (-1.4) |
| 2004.08 | 109.6 | 40.9 | 39.2 (-1.0) |
| 2004.09 | 103.1 | 27.7 | 37.5 (-1.7) |
| 2004.10 | 105.9 | 48.0 | 35.9 (-1.6) |
| 2004.11 | 113.2 | 43.5 | 35.3 (-0.6) |
| 2004.12 | 94.5 | 17.9 | (34.8 predicted, -0.5) |
| 2005.01 | 102.2 | 31.3 | (32.8 predicted, -2.0) |
| 2005.02 | 97.2 | 29.1 | (30.4 predicted, -2.4) |
| 2005.03 | 89.9 | 24.8 | (28.8 predicted, -1.6) |
| 2005.04 | 86.0 | 24.4 | (26.9 predicted, -1.9) |
| 2005.05 | 99.3 | 42.6 | (24.3 predicted, -2.6) |
| 2005.06 | 103.2 (1) | 38.1 (2) | (22.8 predicted, -1.5) |
1) Running average based on the daily 20:00 UTC observed solar flux
value at 2800 MHz.
2) Unofficial, accumulated value based on the Boulder (NOAA/SEC)
sunspot number. The official international sunspot number is typically
30-50% lower.
This report has been prepared by Jan Alvestad. It is based partly on my own observations and analysis, and partly on data from some of these solar data sources. All time references are to the UTC day. Comments and suggestions are always welcome.
| [DX-Listeners' Club] |