
Last major update issued on May 8, 2005 at 04:45 UTC.
[Solar and
geomagnetic data - last month (updated daily)]
[Solar wind and
electron fluence charts (updated daily)]
[Solar cycles 21-23
(last update May 6, 2005)]
[Solar cycles 1-20]
[Graphical comparison
of cycles 21, 22 and 23 (last update May 6, 2005)]
[Graphical
comparison of cycles 2, 10, 13, 17, 20 and 23 (last update May 6, 2005)]
[Historical solar and
geomagnetic data charts 1954-2004 (last update February 1, 2005)]
[Archived reports
(last update May 2, 2005)]
The geomagnetic field was quiet to active on May 7. Solar wind speed ranged between 343 and 541 km/sec.
Solar flux measured at 20h UTC on 2.8 GHz was 99.9. The planetary
A
index was 10 (STAR Ap - based on the mean of three hour interval ap
indices: 10.1).
Three hour interval K indices: 21012234 (planetary), 21112225 (Boulder).
The background x-ray flux is at the class B4 level.
At midnight there were 2 spotted regions on the visible solar disk. The solar flare activity level was moderate. A total of 2 C and 1 M class events was recorded during the day. Region 10756, now behind the southwest limb, produced an M1.4 impulsive flare at 08:13 UTC.
Region 10758 developed many new spots and expanded to cover a huge area. An M class flare is possible.
Spotted regions not numbered by NOAA/SEC:
[S543] This region rotated partly into view at the northeast limb on May 7 and appears to be complex with both
polarities present in the leading penumbra. M flares are possible. Location at midnight: N12E83. Flares:
C1.2 at 08:51 and C1.2 at 11:56 UTC.
May 5: A full halo CME (with very faint extensions over the western limbs) was observed in LASCO C3 images beginning at
21:18 UTC. The source of this CME was probably backsided. Interestingly a bright loop was observed just off the northeast limb
later in the day. It is, however, uncertain if this observation has any relevance to the CME.
May 6: A full halo CME was observed in LASCO C3 images beginning at 18:18 UTC. Material distribution around the disk
suggest a centrally placed backsided source in the northern hemisphere. Another and more interesting moderately fast CME was
observed nearly simultaneously with most of the ejected material seen over the southeast limb. This was at least a partial halo
CME, the presence of the other CME makes it hard to determine the full extent. Its source was the long duration event in region
10758.
May 7: No obviously fully or partly potentially geoeffective CMEs were observed.
Coronal hole
history (since late October 2002)
Compare today's report with the situation one solar rotation ago: 28
days ago 27 days ago 26 days ago
A large recurrent coronal hole (CH163) in the northern hemisphere was in an Earth facing position on May 6-7.
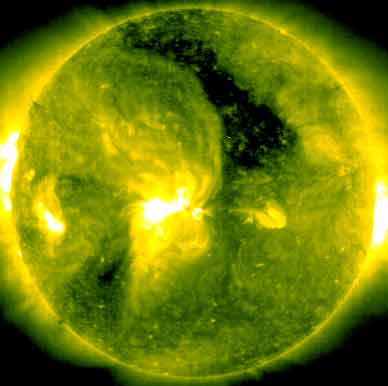
Processed SOHO/EIT 284 image at 01:06 UTC on May 8. The darkest areas on the solar disk are likely coronal holes.
The geomagnetic field is expected be unsettled to major storm on May 8-10 due to a high speed stream from CH163 and the arrival of a CME observed on May 6.
| Coronal holes (1) | Coronal mass ejections (2) | M and X class flares (3) |
1) Effects from a coronal hole could reach Earth
within the next 5 days. When the high speed stream has arrived
the color changes to green.
2) Material from a CME is likely to impact Earth within 96 hours.
3) There is a possibility of either M or X class flares within the next
48 hours.
Green: 0-20% probability, Yellow: 20-60% probability, Red: 60-100% probability.
Long distance low and medium frequency (below 2 MHz) propagation along east-west paths over high and upper middle latitudes is very poor. Propagation along long distance north-south paths is fair. Trans Atlantic propagation conditions are normally monitored every night on 1470 kHz. Dominant station tonight: Radio Cristal del Uruguay. Propagation favored stations from Argentina and Uruguay on other frequencies as well. In particular the Buenos Aires stations on 710, 790 and 870 kHz had fair to good signals.

Compare to the previous day's image.
Data for all numbered solar regions according to the Solar Region Summary provided by NOAA/SEC. Comments are my own, as is the STAR spot count (spots observed at or inside a few hours before midnight) and data for regions not numbered by SEC or where SEC has observed no spots. SEC active region numbers in the table below and in the active region map above are the historic SEC/USAF numbers.
| Active region | Date numbered | SEC spot count |
STAR spot count |
Location at midnight | Area | Classification | Comment |
|---|---|---|---|---|---|---|---|
| 10756 | 2005.04.25 | 4 | S07W88 | 0260 | DSO | rotated out of view | |
| 10758 | 2005.05.02 | 31 | 42 | S07E10 | 0140 | FAI |
beta-gamma
longitudinal extent: 20 degrees location: S08E07 |
| S541 | emerged on 2005.04.29 |
S15W64 | plage | ||||
| S543 | visible on 2005.05.07 |
1 | N12E83 | 0300 | HHX | ||
| Total spot count: | 35 | 43 | |||||
| SSN: | 55 | 63 | |||||
| Month | Average solar flux at Earth |
International sunspot number | Smoothed sunspot number |
|---|---|---|---|
| 2000.04 | 184.2 | 125.5 | 120.8 cycle 23 sunspot max. |
| 2000.07 | 202.3 | 170.1 | 119.8 |
| 2001.12 | 235.1 | 132.2 | 114.6 (-0.9) |
| 2004.03 | 112.0 | 49.1 | 47.1 (-2.2) |
| 2004.04 | 101.2 | 39.3 | 45.5 (-1.6) |
| 2004.05 | 99.8 | 41.5 | 43.8 (-1.7) |
| 2004.06 | 97.4 | 43.2 | 41.6 (-2.2) |
| 2004.07 | 119.1 | 51.1 | 40.2 (-1.4) |
| 2004.08 | 109.6 | 40.9 | 39.2 (-1.0) |
| 2004.09 | 103.1 | 27.7 | 37.5 (-1.7) |
| 2004.10 | 105.9 | 48.0 | 35.9 (-1.6) |
| 2004.11 | 113.2 | 43.5 | (34.8 predicted, -1.1) |
| 2004.12 | 94.5 | 17.9 | (33.4 predicted, -1.4) |
| 2005.01 | 102.2 | 31.3 | (30.9 predicted, -2.5) |
| 2005.02 | 97.2 | 29.1 | (28.3 predicted, -2.6) |
| 2005.03 | 89.9 | 24.8 | (26.5 predicted, -1.8) |
| 2005.04 | 86.0 | 24.4 | (24.6 predicted, -1.9) |
| 2005.05 | 109.2 (1) | 12.0 (2) | (22.0 predicted, -2.6) |
1) Running average based on the daily 20:00 UTC observed solar flux
value at 2800 MHz.
2) Unofficial, accumulated value based on the Boulder (NOAA/SEC)
sunspot number. The official international sunspot number is typically
30-50% less.
This report has been prepared by Jan Alvestad. It is based partly on my own observations and analysis, and partly on data from some of these solar data sources. All time references are to the UTC day. Comments and suggestions are always welcome.
| [DX-Listeners' Club] |