
Last major update issued on May 29, 2005 at 05:00 UTC.
[Solar and
geomagnetic data - last month (updated daily)]
[Solar wind and
electron fluence charts (updated daily)]
[Solar cycles 21-23
(last update May 6, 2005)]
[Solar cycles 1-20]
[Graphical comparison
of cycles 21, 22 and 23 (last update May 6, 2005)]
[Graphical
comparison of cycles 2, 10, 13, 17, 20 and 23 (last update May 6, 2005)]
[Historical solar and
geomagnetic data charts 1954-2004 (last update February 1, 2005)]
[Archived reports
(last update May 15, 2005)]
The geomagnetic field was quiet to active on May 28. Solar wind speed ranged between 275 and 451 km/sec. A weak solar wind shock was observed at SOHO at 03:47 UTC. This marked the onset of a fairly low speed stream from CH167.
Solar flux measured at 20h UTC on 2.8 GHz was 92.5. The planetary
A
index was 13 (STAR Ap - based on the mean of three hour interval ap
indices: 13.4).
Three hour interval K indices: 13222444 (planetary), 13322444 (Boulder).
The background x-ray flux is at the class B1 level.
At midnight there were 3 spotted regions on the visible solar disk. The solar flare activity level was low. A total of 4 C class events was recorded during the day.
Region 10766 was quiet and stable.
Region 10767 decayed, particularly in the northeastern section. The magnetic delta structure disappeared, however, the
separation between the opposite polarities in the trailing spot section is still poor. Flares:
C5.4 at 02:30 and C1.1 at 04:59 UTC.
New region 10769 rotated into view at the southeast limb. Flares: C1.0 at 17:26 and
C1.7 at 22:17 UTC.
May 27-28: No obviously fully or partly potentially geoeffective CMEs were observed.
May 26: A full halo CME was observed after a filament eruption in region 10767 during the early afternoon. This CME will
likely reach Earth on May 29. Further ejected material was observed later in the day after the C8 long duration event in region 10767.
Coronal hole
history (since late October 2002)
Compare today's report with the situation one solar rotation ago: 28
days ago 27 days ago 26
days ago
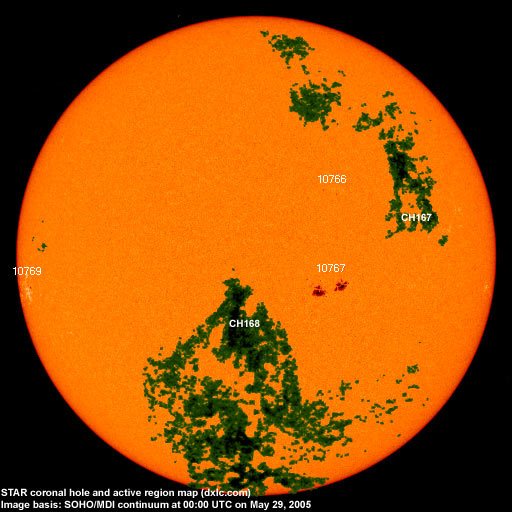
A recurrent coronal hole (CH167) in the northern hemisphere was in an Earth facing position on May 24-26. CH167 has lost most of its area over the last rotation. A coronal hole (CH168) in the southern hemisphere could rotate into an Earth facing position on May 29.

Processed SOHO/EIT 284 image at 01:06 UTC on May 29. The darkest areas on the solar disk are likely coronal holes.
The geomagnetic field is expected to be unsettled to major storm on May 29-30 as a CME is likely to reach Earth near noon on May 29. Quiet to unsettled is likely on May 31 while effects from CH168 could cause unsettled to active conditions on June 1.
| Coronal holes (1) | Coronal mass ejections (2) | M and X class flares (3) |
1) Effects from a coronal hole could reach Earth
within the next 5 days. When the high speed stream has arrived
the color changes to green.
2) Material from a CME is likely to impact Earth within 96 hours.
3) There is a possibility of either M or X class flares within the next
48 hours.
Green: 0-20% probability, Yellow: 20-60% probability, Red: 60-100% probability.
Long distance low and medium frequency (below 2 MHz) propagation along east-west paths over high and upper middle latitudes is very poor. Propagation along long distance north-south paths is poor to fair. Trans Atlantic propagation conditions are normally monitored every night on 1470 kHz. Dominant stations tonight: Radio Cristal del Uruguay and Radio Rafaela (Argentina). Radio Champaqu� (Argentina) was noted on 1510 kHz, otherwise only a few stations from Argentina and Brazil were audible.
Compare to the previous day's image.
Data for all numbered solar regions according to the Solar Region Summary provided by NOAA/SEC. Comments are my own, as is the STAR spot count (spots observed at or inside a few hours before midnight) and data for regions not numbered by SEC or where SEC has observed no spots. SEC active region numbers in the table below and in the active region map above are the historic SEC/USAF numbers.
| Active region | Date numbered | SEC spot count |
STAR spot count |
Location at midnight | Area | Classification | Comment |
|---|---|---|---|---|---|---|---|
| 10765 | 2005.05.19 | N08W55 | plage | ||||
| 10766 | 2005.05.21 | 3 | 2 | N13W19 | 0020 | AXX | classification was BXO at midnight, area 0010 |
| 10767 | 2005.05.21 | 25 | 31 | S08W16 | 0300 | DAO |
beta-gamma classification was DAI at midnight |
| 10768 | 2005.05.26 | 2 | S10W77 | 0020 | BXO | spotless | |
| 10769 | 2005.05.28 | 1 | 1 | S07E69 | 0050 | HSX | area was 0030 at midnight |
| Total spot count: | 31 | 34 | |||||
| SSN: | 71 | 64 | |||||
| Month | Average solar flux at Earth |
International sunspot number | Smoothed sunspot number |
|---|---|---|---|
| 2000.04 | 184.2 | 125.5 | 120.8 cycle 23 sunspot max. |
| 2000.07 | 202.3 | 170.1 | 119.8 |
| 2001.12 | 235.1 | 132.2 | 114.6 (-0.9) |
| 2004.03 | 112.0 | 49.1 | 47.1 (-2.2) |
| 2004.04 | 101.2 | 39.3 | 45.5 (-1.6) |
| 2004.05 | 99.8 | 41.5 | 43.8 (-1.7) |
| 2004.06 | 97.4 | 43.2 | 41.6 (-2.2) |
| 2004.07 | 119.1 | 51.1 | 40.2 (-1.4) |
| 2004.08 | 109.6 | 40.9 | 39.2 (-1.0) |
| 2004.09 | 103.1 | 27.7 | 37.5 (-1.7) |
| 2004.10 | 105.9 | 48.0 | 35.9 (-1.6) |
| 2004.11 | 113.2 | 43.5 | (34.8 predicted, -1.1) |
| 2004.12 | 94.5 | 17.9 | (33.4 predicted, -1.4) |
| 2005.01 | 102.2 | 31.3 | (30.9 predicted, -2.5) |
| 2005.02 | 97.2 | 29.1 | (28.3 predicted, -2.6) |
| 2005.03 | 89.9 | 24.8 | (26.5 predicted, -1.8) |
| 2005.04 | 86.0 | 24.4 | (24.6 predicted, -1.9) |
| 2005.05 | 99.9 (1) | 58.6 (2) | (22.0 predicted, -2.6) |
1) Running average based on the daily 20:00 UTC observed solar flux
value at 2800 MHz.
2) Unofficial, accumulated value based on the Boulder (NOAA/SEC)
sunspot number. The official international sunspot number is typically
30-50% less.
This report has been prepared by Jan Alvestad. It is based partly on my own observations and analysis, and partly on data from some of these solar data sources. All time references are to the UTC day. Comments and suggestions are always welcome.
| [DX-Listeners' Club] |