
Last major update issued on November 20, 2005 at 06:40 UTC.
[Solar and
geomagnetic data - last month (updated daily)]
[Solar wind and
electron fluence charts (updated daily)]
[Solar cycles 21-23
(last update November 9, 2005)]
[Solar cycles 1-20]
[Graphical comparison
of cycles 21, 22 and 23 (last update November 9, 2005)]
[Graphical
comparison of cycles 2, 10, 13, 17, 20 and 23 (last update November 9,
2005)]
[Historical solar and
geomagnetic data charts 1954-2004 (last update February 1, 2005)]
[Archived reports
(last update November 2, 2005)]
The geomagnetic field was quiet to active on November 19. Solar wind speed ranged between 304 and 380 (all day average 338) km/sec, most of the day under the influence of a low speed stream from CH198.
Solar flux measured at 20h UTC on 2.8 GHz was 102.0. The planetary
A
index was 10 (STAR Ap - based on the mean of three hour interval ap
indices: 10.0)
Three hour interval K indices: 10001443 (planetary), 01113442 (Boulder).
The background x-ray flux is at the class B2 level.
At midnight there were 4 spotted regions on the visible solar disk. The solar flare activity level was low. A total of 1 C class event was recorded during the day.
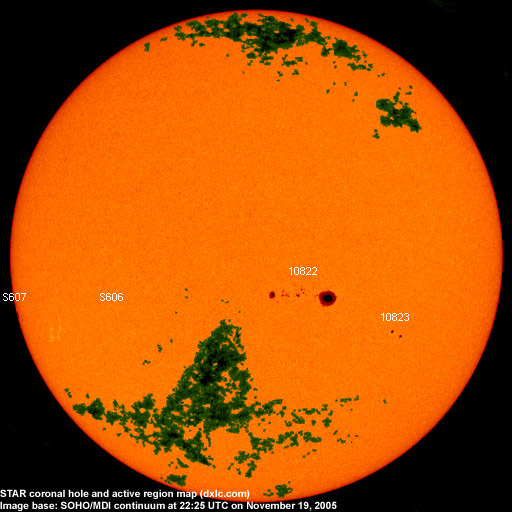
Region 10822 did not change significantly and remains capable of producing occasional minor M class flares. Flares:
C1.5 at 20:19 UTC.
New region 10823 emerged quickly early in the day, then the opposite polarity areas began to drift apart. The region is
currently simple structured and will likely decay unless new flux emerges.
Spotted regions not numbered by NOAA/SEC
[S606] This region emerged in the southeast quadrant on November 19 with a single small spot. Location at midnight:
S10E35.
[S607] A new region rotated partly into view at the southeast limb on Nov.19. Location at midnight: S13E80.
November 17-19: No obvious fully or partly Earth directed CMEs were observed.
Coronal hole
history (since late October 2002)
Compare today's report with the situation one solar rotation ago: 28
days ago 27 days ago 26
days ago
A small trans equatorial coronal hole (CH198) was in an Earth facing position on November 16. The northernmost extension of a southern hemisphere coronal hole could rotate into a potentially geoeffective position on November 20.
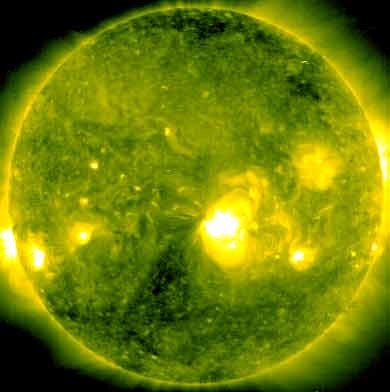
Processed SOHO/EIT 284 image at 19:06 UTC on November 19. The darkest areas on the solar disk are likely coronal holes.
The geomagnetic field is expected to be quiet to unsettled on November 20-22.
| Coronal holes (1) | Coronal mass ejections (2) | M and X class flares (3) |
1) Effects from a coronal hole could reach Earth
within the next 5 days. When the high speed stream has arrived
the color changes to green.
2) Material from a CME is likely to impact Earth within 96 hours.
3) There is a possibility of either M or X class flares within the next
48 hours.
Green: 0-20% probability, Yellow: 20-60% probability, Red: 60-100% probability.
Long distance low and medium frequency (below 2 MHz) propagation along east-west paths over high and upper middle latitudes is poor to very poor (was fair early in the night). Propagation on long distance northeast-southwest paths is poor. Trans Atlantic propagation conditions are normally monitored every night on 1470 kHz. Dominant station Radio Vibraci�n (Venezuela). Early in the night a number of stations from the eastern parts of North America were audible, while only a couple of weak signals made it across the Atlantic at 06 UTC.
Compare to the previous day's image.
Data for all numbered solar regions according to the Solar Region Summary provided by NOAA/SEC. Comments are my own, as is the STAR spot count (spots observed at or inside a few hours before midnight) and data for regions not numbered by SEC or where SEC has observed no spots. SEC active region numbers in the table below and in the active region map above are the historic SEC/USAF numbers.
| Active region | Date numbered | SEC spot count |
STAR spot count |
Location at midnight | Area | Classification | Comment |
|---|---|---|---|---|---|---|---|
| 10822 | 2005.11.12 | 26 | 30 | S08W12 | 0610 | FKC | beta-gamma classification was FKI at midnight |
| 10823 | 2005.11.19 | 6 | 5 | S18W37 | 0040 | DSO | |
| S606 | 2005.11.19 | 1 | S10E35 | 0000 | AXX | ||
| S607 | 2005.11.19 | 2 | S13E80 | 0070 | HAX | ||
| Total spot count: | 32 | 38 | |||||
| SSN: | 52 | 78 | |||||
| Month | Average solar flux at Earth |
International sunspot number | Smoothed sunspot number |
|---|---|---|---|
| 2000.04 | 184.2 | 125.5 | 120.8 cycle 23 sunspot max. |
| 2000.07 | 202.3 | 170.1 | 119.8 |
| 2001.12 | 235.1 | 132.2 | 114.6 (-0.9) |
| 2004.09 | 103.1 | 27.7 | 37.5 (-1.7) |
| 2004.10 | 105.9 | 48.0 | 35.9 (-1.6) |
| 2004.11 | 113.2 | 43.5 | 35.3 (-0.6) |
| 2004.12 | 94.5 | 17.9 | 35.2 (-0.1) |
| 2005.01 | 102.2 | 31.3 | 34.6 (-0.6) |
| 2005.02 | 97.2 | 29.2 | 33.9 (-0.7) |
| 2005.03 | 89.9 | 24.5 | 33.5 (-0.4) |
| 2005.04 | 86.0 | 24.4 | 31.6 (-1.9) |
| 2005.05 | 99.3 | 42.6 | (28.9 predicted, -2.7) |
| 2005.06 | 93.7 | 39.6 | (27.3 predicted, -1.6) |
| 2005.07 | 96.4 | 39.9 | (26.1 predicted, -1.2) |
| 2005.08 | 90.5 | 36.4 | (24.3 predicted, -1.8) |
| 2005.09 | 91.1 | 22.1 | (22.2 predicted, -2.1) |
| 2005.10 | 77.0 | 8.5 | (20.2 predicted, -2.0) |
| 2005.11 | 85.5 (1) | 18.6 (2) | (17.8 predicted, -2.4) |
1) Running average based on the daily 20:00 UTC observed solar flux
value at 2800 MHz.
2) Unofficial, accumulated value based on the Boulder (NOAA/SEC)
sunspot number. The official international sunspot number is typically
30-50% lower.
This report has been prepared by Jan Alvestad. It is based partly on my own observations and analysis, and partly on data from some of these solar data sources. All time references are to the UTC day. Comments and suggestions are always welcome.
| [DX-Listeners' Club] |