
Last major update issued on September 5,
2005 at 04:10 UTC.
[Solar and
geomagnetic data - last month (updated daily)]
[Solar wind and
electron fluence charts (updated daily)]
[Solar cycles 21-23
(last update September 3, 2005)]
[Solar cycles 1-20]
[Graphical comparison
of cycles 21, 22 and 23 (last update September 3, 2005)]
[Graphical
comparison of cycles 2, 10, 13, 17, 20 and 23 (last update September 3,
2005)]
[Historical solar and
geomagnetic data charts 1954-2004 (last update February 1, 2005)]
[Archived reports
(last update September 2 , 2005)]
The geomagnetic field was quiet to minor storm on September 4. Solar wind speed ranged between 555 and 893 (all day average 698) km/sec under the influence of a high speed stream from CH185.
Solar flux measured at 20h UTC on 2.8 GHz was 74.6. The planetary
A
index was 26 (STAR Ap - based on the mean of three hour interval ap
indices: 25.5).
Three hour interval K indices: 44553323 (planetary), 44553323 (Boulder).
The background x-ray flux is at the class A4 level.
At midnight there was 1 spotted region on the visible solar disk. The solar flare activity level was low. A single C class event was recorded during the day, a long duration C2.0 peaking at 14:08 with its source in spotless region 10803.
Region 10805 decayed slowly and quietly.
September 2-4: At 03:42 UTC on September 3 another large, full halo CME was observed in LASCO images. The source was about 3-4 days behind the southeast limb. This backsided region has produced several large CMEs over the last week. A CME was observed over the west limbs following a long duration C2 event in region 10803 during the afternoon on September 4.
Coronal hole
history (since late October 2002)
Compare today's report with the situation one solar rotation ago: 28
days ago 27 days ago 26
days ago
A poorly defined recurrent coronal hole (CH186) in the northern hemisphere will likely be in an Earth facing position on September 4-5.

Processed SOHO/EIT 284 image at 13:06 UTC on September 2. The darkest areas on the solar disk are likely coronal holes.
The geomagnetic field is expected to be quiet to active on September 5 and quiet to unsettled on September 6. Effects from CH186 are possible on September 7-8 with some unsettled to active intervals likely.
| Coronal holes (1) | Coronal mass ejections (2) | M and X class flares (3) |
1) Effects from a coronal hole could reach Earth
within the next 5 days. When the high speed stream has arrived
the color changes to green.
2) Material from a CME is likely to impact Earth within 96 hours.
3) There is a possibility of either M or X class flares within the next
48 hours.
Green: 0-20% probability, Yellow: 20-60% probability, Red: 60-100% probability.
Long distance low and medium frequency (below 2 MHz) propagation along east-west paths over high and upper middle latitudes is poor. Propagation on long distance northeast-southwest paths is fair to poor. Trans Atlantic propagation conditions are normally monitored every night on 1470 kHz. Dominant stations tonight: Radio Cristal del Uruguay and Radio Vibraci�n (Venezuela), both with fairly strong signals. A few of the most common northeastern USA stations (like 1030 WBZ, 1130 WBBR, 1510 WWZN) were all noted with weak signals.
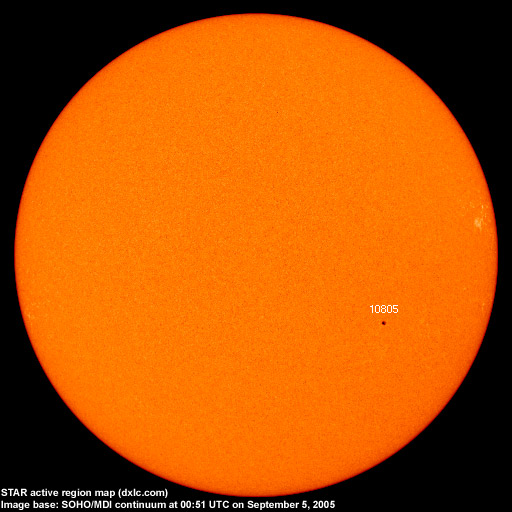
Compare to the previous day's image.
Data for all numbered solar regions according to the Solar Region Summary provided by NOAA/SEC. Comments are my own, as is the STAR spot count (spots observed at or inside a few hours before midnight) and data for regions not numbered by SEC or where SEC has observed no spots. SEC active region numbers in the table below and in the active region map above are the historic SEC/USAF numbers.
| Active region | Date numbered | SEC spot count |
STAR spot count |
Location at midnight | Area | Classification | Comment |
|---|---|---|---|---|---|---|---|
| 10803 | 2005.08.24 | N11W65 | plage | ||||
| 10805 | 2005.08.27 | 2 | 1 | S11W30 | 0060 | CSO | area was 0040 at midnight |
| 10806 | 2005.08.29 | S16W32 | plage | ||||
| S588 | 2005.08.31 | N12W23 | plage | ||||
| Total spot count: | 2 | 1 | |||||
| SSN: | 12 | 11 | |||||
| Month | Average solar flux at Earth |
International sunspot number | Smoothed sunspot number |
|---|---|---|---|
| 2000.04 | 184.2 | 125.5 | 120.8 cycle 23 sunspot max. |
| 2000.07 | 202.3 | 170.1 | 119.8 |
| 2001.12 | 235.1 | 132.2 | 114.6 (-0.9) |
| 2004.07 | 119.1 | 51.1 | 40.2 (-1.4) |
| 2004.08 | 109.6 | 40.9 | 39.2 (-1.0) |
| 2004.09 | 103.1 | 27.7 | 37.5 (-1.7) |
| 2004.10 | 105.9 | 48.0 | 35.9 (-1.6) |
| 2004.11 | 113.2 | 43.5 | 35.3 (-0.6) |
| 2004.12 | 94.5 | 17.9 | 35.2 (-0.1) |
| 2005.01 | 102.2 | 31.3 | 34.6 (-0.6) |
| 2005.02 | 97.2 | 29.2 | 33.9 (-0.7) |
| 2005.03 | 89.9 | 24.5 | (33.5 predicted, -0.4) |
| 2005.04 | 86.0 | 24.4 | (32.2 predicted, -1.3) |
| 2005.05 | 99.3 | 42.6 | (29.9 predicted, -2.3) |
| 2005.06 | 93.7 | 39.6 | (28.7 predicted, -1.2) |
| 2005.07 | 96.4 | 39.9 | (27.7 predicted, -1.0) |
| 2005.08 | 90.5 | 36.4 | (25.8 predicted, -1.9) |
| 2005.09 | 76.3 (1) | 2.6 (2) | (24.2 predicted, -1.6) |
1) Running average based on the daily 20:00 UTC observed solar flux
value at 2800 MHz.
2) Unofficial, accumulated value based on the Boulder (NOAA/SEC)
sunspot number. The official international sunspot number is typically
30-50% lower.
This report has been prepared by Jan Alvestad. It is based partly on my own observations and analysis, and partly on data from some of these solar data sources. All time references are to the UTC day. Comments and suggestions are always welcome.
| [DX-Listeners' Club] |