Last major update issued on January 16, 2006 at 05:30 UTC.
[Solar
and
geomagnetic data - last month (updated daily)]
[Solar
wind and
electron fluence charts (updated daily)]
[Solar
cycles 21-23
(last update January 8, 2006)]
[Solar
cycles 1-20]
[Graphical
comparison
of cycles 21, 22 and 23 (last update January 8, 2006)]
[Graphical
comparison of cycles 2, 10, 13, 17, 20 and 23 (last update January 8, 2006)]
[Historical
solar and
geomagnetic data charts 1954-2004 (last update February 1, 2005)]
[Archived
reports
(last update January 8, 2006)]
The geomagnetic field was inactive to quiet on January 13. Solar wind speed ranged between 327 and 428 (all day average 353) km/sec. The stream from CH205 began to dominate the solar wind after 15h UTC. Only a minor increase in geomagnetic activity was observed as the interplanetary magnetic field remained mostly northwards. Stronger southward fluctuations have been observed early on January 16.
Solar flux measured at 20h UTC on 2.8 GHz was 80.9. The planetary A
index was 4 (STAR Ap - based on the mean of three hour interval ap
indices: 4.0).
Three hour interval K indices: 21000222 (planetary), 11101222 (Boulder).
The background x-ray flux is at the class A3 level.
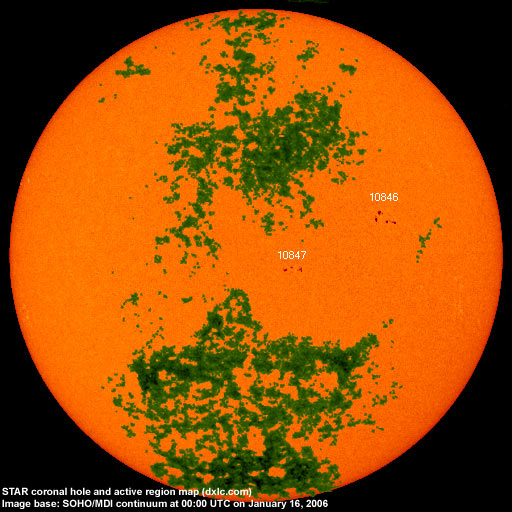
At midnight there were two spotted regions on the visible solar disk. The solar flare activity level was low. A single C class event was recorded during the day.
New region 10846 emerged in the northern hemisphere late on January 14 and developed quickly on January 15. C flares are
possible.
New region 10847 emerged quickly in the southwest quadrant on January 15. Flare: C1.0
at 14:45 UTC.
January 13-15: No obviously fully or partly Earth directed CMEs were observed.
Coronal hole history (since late October 2002)
Compare today's report with the
situation one solar rotation ago: 28
days ago 27 days ago
26
days ago
A trans equatorial coronal hole (CH205) was in an Earth facing position late on January 12 and on January 13.
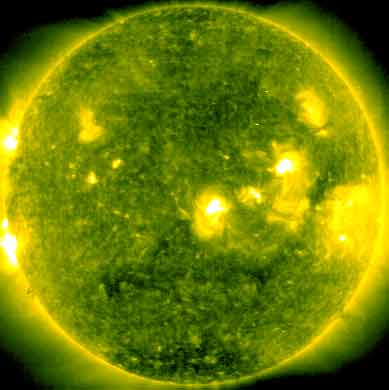
Processed SOHO/EIT 284 image at 19:06 UTC on January 15. The darkest areas on the solar disk are likely coronal holes.
The geomagnetic field is expected to be quiet to active on January 16, quiet to unsettled on January 17 and quiet on January 18.
| Coronal holes (1) | Coronal mass ejections (2) | M and X class flares (3) |
1) Effects from a coronal hole could reach Earth
within the next 5 days. When the high speed stream has arrived the color changes to green.
2) Effects from a CME are likely to be observed at Earth within 96 hours.
3) There is a possibility of either M or X class flares within the next 48 hours.
Green: 0-20% probability, Yellow: 20-60% probability, Red: 60-100% probability.
/* No monitoring on January 16, propagation during the weekend was excellent to North America */ Long distance low and medium frequency (below 2 MHz) propagation along east-west paths over high and upper middle latitudes is excellent. Propagation on long distance northeast-southwest paths is very poor. Trans Atlantic propagation conditions are normally monitored every night on 1470 kHz. Dominant station tonight: WLAM Lewiston ME. On other frequencies there were many stations from mostly the eastern half of North America. As an example 870 kHz had WWL New Orleans as a clear dominant. During WWL fades it was possible to hear two other stations, one with a news talk format (possibly Ithaca, NY station) and another with oldies. On 1000 kHz KOMO Seattle WA had, at times, a strong signal.
Compare to the previous day's image.
Data for all numbered solar regions according to the Solar Region Summary provided by NOAA/SEC. Comments are my own, as is the STAR spot count (spots observed at or inside a few hours before midnight) and data for regions not numbered by SEC or where SEC has observed no spots. SEC active region numbers in the table below and in the active region map above are the historic SEC/USAF numbers.
| Active region | Date numbered | SEC spot count |
STAR spot count |
Location at midnight | Area | Classification | Comment |
|---|---|---|---|---|---|---|---|
| 10846 | 2006.01.15 | 7 | 17 | N05W30 | 0040 | DSO | classification was DAI, area 0080 at midnight |
| 10847 | 2006.01.15 | 5 | 12 | S09W08 | 0030 | CAO | classification was DAI, area 0050 at midnight |
| Total spot count: | 12 | 29 | |||||
| SSN: | 32 | 49 | |||||
| Month | Average solar flux at Earth |
International sunspot number | Smoothed sunspot number |
|---|---|---|---|
| 2000.04 | 184.2 | 125.5 | 120.8 cycle 23 sunspot max. |
| 2000.07 | 202.3 | 170.1 | 119.8 |
| 2001.12 | 235.1 | 132.2 | 114.6 (-0.9) |
| 2004.11 | 113.2 | 43.5 | 35.3 (-0.6) |
| 2004.12 | 94.5 | 17.9 | 35.2 (-0.1) |
| 2005.01 | 102.2 | 31.3 | 34.6 (-0.6) |
| 2005.02 | 97.2 | 29.2 | 33.9 (-0.7) |
| 2005.03 | 89.9 | 24.5 | 33.5 (-0.4) |
| 2005.04 | 86.0 | 24.4 | 31.6 (-1.9) |
| 2005.05 | 99.3 | 42.6 | 28.9 (-2.7) |
| 2005.06 | 93.7 | 39.6 | 28.8 (-0.1) |
| 2005.07 | 96.4 | 39.9 | (29.1 predicted, +0.3) |
| 2005.08 | 90.5 | 36.4 | (27.4 predicted, -1.7) |
| 2005.09 | 91.1 | 22.1 | (25.4 predicted, -2.0) |
| 2005.10 | 77.0 | 8.5 | (23.4 predicted, -2.0) |
| 2005.11 | 86.3 | 18.0 | (21.0 predicted, -2.4) |
| 2005.12 | 90.7 | 41.2 | (18.2 predicted, -2.8) |
| 2006.01 | 80.5 (1) | 9.3 (2) | (15.2 predicted, -3.0) |
1) Running average based on the
daily 20:00 UTC observed solar flux
value at 2800 MHz.
2) Unofficial, accumulated value based on the Boulder (NOAA/SEC)
sunspot number. The official international sunspot number is typically
30-50% lower.
This report has been prepared by Jan Alvestad. It is based partly on my own observations and analysis, and partly on data from some of these solar data sources. All time references are to the UTC day. Comments and suggestions are always welcome.
| [DX-Listeners' Club] |