Last major update issued on January 24, 2006 at 05:15 UTC.
[Solar
and
geomagnetic data - last month (updated daily)]
[Solar
wind and
electron fluence charts (updated daily)]
[Solar
cycles 21-23
(last update January 8, 2006)]
[Solar
cycles 1-20]
[Graphical
comparison
of cycles 21, 22 and 23 (last update January 8, 2006)]
[Graphical
comparison of cycles 2, 10, 13, 17, 20 and 23 (last update January 8, 2006)]
[Historical
solar and
geomagnetic data charts 1954-2004 (last update February 1, 2005)]
[Archived
reports
(last update January 8, 2006)]
The geomagnetic field was quiet to active on January 23. Solar wind speed ranged between 354 and 648 (all day average 521) km/sec under the influence of a high speed stream from CH206.
Solar flux measured at 20h UTC on 2.8 GHz was 92.4. The planetary A
index was 15 (STAR Ap - based on the mean of three hour interval ap
indices: 15.0).
Three hour interval K indices: 14343223 (planetary), 14353333 (Boulder).
The background x-ray flux is at the class B1 level.
At midnight there were 3 spotted regions on the visible solar disk. The solar flare activity level was low. A total of 1 C class event was recorded during the day.
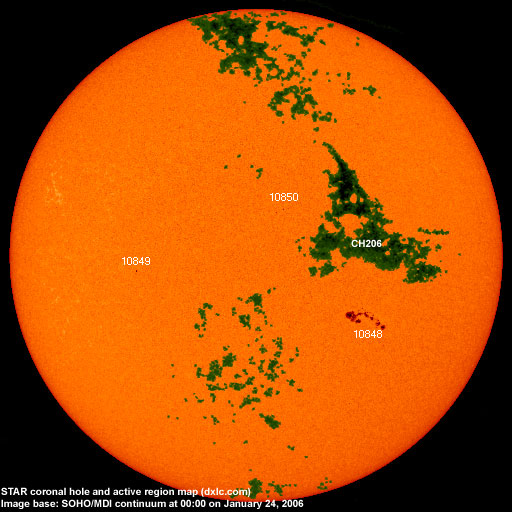
Region 10848 decayed during the first half of the day, then began to develop again as new negative polarity flux emerged
in the eastern central part of the region. A weak magnetic delta structure developed late in the day. Further C class flares are
likely and there is a chance of a minor M class flare. Flare: C3.2 at 22:17 UTC.
Region 10849 was quiet and stable.
New region 10850 emerged late on January 22 in the northeast quadrant, developed early in the day, then began to decay.
January 21-23: No obviously fully or partly Earth directed CMEs were observed.
Coronal hole history (since late October 2002)
Compare today's report with the
situation one solar rotation ago: 28
days ago 27 days ago
26
days ago
A recurrent trans equatorial coronal hole (CH206) was in an Earth facing position on January 21-23. CH206 has decayed in the southern part over the last solar rotation.
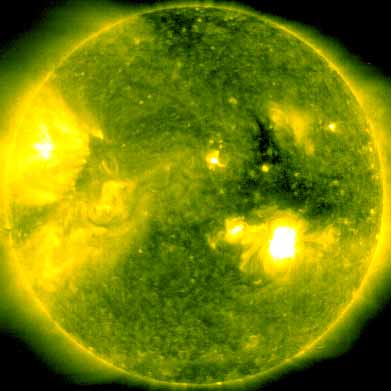
Processed SOHO/EIT 284 image at 01:06 UTC on January 24. The darkest areas on the solar disk are likely coronal holes.
The geomagnetic field is expected to be quiet to active on January 24 due to effects from CH206 and quiet to unsettled on January 25-26.
| Coronal holes (1) | Coronal mass ejections (2) | M and X class flares (3) |
1) Effects from a coronal hole could reach Earth
within the next 5 days. When the high speed stream has arrived the color changes to green.
2) Effects from a CME are likely to be observed at Earth within 96 hours.
3) There is a possibility of either M or X class flares within the next 48 hours.
Green: 0-20% probability, Yellow: 20-60% probability, Red: 60-100% probability.
Long distance low and medium frequency (below 2 MHz) propagation along east-west paths over high and upper middle latitudes is poor. Propagation on long distance northeast-southwest paths is very poor. Trans Atlantic propagation conditions are normally monitored every night on 1470 kHz. Dominant station tonight: Radio Vibraci�n (Venezuela). On other frequencies only a few stations from North America were heard with generally poor signals. Propagation was best to Puerto Rico, Venezuela and Colombia.
Compare to the previous day's image.
Data for all numbered solar regions according to the Solar Region Summary provided by NOAA/SEC. Comments are my own, as is the STAR spot count (spots observed at or inside a few hours before midnight) and data for regions not numbered by SEC or where SEC has observed no spots. SEC active region numbers in the table below and in the active region map above are the historic SEC/USAF numbers.
| Active region | Date numbered | SEC spot count |
STAR spot count |
Location at midnight | Area | Classification | Comment |
|---|---|---|---|---|---|---|---|
| 10848 | 2006.01.18 | 36 | 37 | S19W28 | 0230 | EAC | beta-gamma-delta area was 0370 at midnight |
| 10849 | 2006.01.22 | 1 | 1 | S07E31 | 0010 | HSX | |
| 10850 | 2006.01.23 | 6 | 2 | N06W05 | 0030 | DSO | formerly region S619 classification was BXO at midnight, area 0010 |
| Total spot count: | 43 | 40 | |||||
| SSN: | 73 | 70 | |||||
| Month | Average solar flux at Earth |
International sunspot number | Smoothed sunspot number |
|---|---|---|---|
| 2000.04 | 184.2 | 125.5 | 120.8 cycle 23 sunspot max. |
| 2000.07 | 202.3 | 170.1 | 119.8 |
| 2001.12 | 235.1 | 132.2 | 114.6 (-0.9) |
| 2004.11 | 113.2 | 43.5 | 35.3 (-0.6) |
| 2004.12 | 94.5 | 17.9 | 35.2 (-0.1) |
| 2005.01 | 102.2 | 31.3 | 34.6 (-0.6) |
| 2005.02 | 97.2 | 29.2 | 33.9 (-0.7) |
| 2005.03 | 89.9 | 24.5 | 33.5 (-0.4) |
| 2005.04 | 86.0 | 24.4 | 31.6 (-1.9) |
| 2005.05 | 99.3 | 42.6 | 28.9 (-2.7) |
| 2005.06 | 93.7 | 39.6 | 28.8 (-0.1) |
| 2005.07 | 96.4 | 39.9 | (29.1 predicted, +0.3) |
| 2005.08 | 90.5 | 36.4 | (27.4 predicted, -1.7) |
| 2005.09 | 91.1 | 22.1 | (25.4 predicted, -2.0) |
| 2005.10 | 77.0 | 8.5 | (23.4 predicted, -2.0) |
| 2005.11 | 86.3 | 18.0 | (21.0 predicted, -2.4) |
| 2005.12 | 90.7 | 41.2 | (18.2 predicted, -2.8) |
| 2006.01 | 83.4 (1) | 21.3 (2) | (15.2 predicted, -3.0) |
1) Running average based on the
daily 20:00 UTC observed solar flux
value at 2800 MHz.
2) Unofficial, accumulated value based on the Boulder (NOAA/SEC)
sunspot number. The official international sunspot number is typically
30-50% lower.
This report has been prepared by Jan Alvestad. It is based partly on my own observations and analysis, and partly on data from some of these solar data sources. All time references are to the UTC day. Comments and suggestions are always welcome.
| [DX-Listeners' Club] |