
Last major update issued on July 2, 2006 at 04:25 UTC.
[Solar and
geomagnetic data - last month (updated daily)]
[Solar wind and
electron fluence charts (updated daily)]
[Solar cycles 21-23
(last update June 7, 2006)]
[Solar cycles 1-20]
[Graphical comparison
of cycles 21, 22 and 23 (last update June 7, 2006)]
[Graphical
comparison of cycles 2, 10, 13, 17, 20 and 23 (last update June 7, 2006)]
[Historical solar and
geomagnetic data charts 1954-2005 (last update March 3, 2006)]
[Archived reports (last update
June 5, 2006)]
The geomagnetic field was quiet on July 1. Solar wind speed ranged between 414 and 458 km/s (all day average 443 km/s - decreasing 60 km/s from the previous day).
Solar flux measured at 20h UTC on 2.8 GHz was 85.5. The planetary A index
was 5 (STAR Ap - based on the mean of three hour interval ap
indices: 4.8).
Three hour interval K indices: 12101211 (planetary), 13211001 (Boulder).
The background x-ray flux is at the class A6 level.
At midnight there were 2 spotted regions on the visible solar disk. The solar flare activity level was very low. No C class events were recorded during the day.
Region 10897 decayed slowly and could become spotless today.
Region 10898 added a few small spots. Magnetically the region is not that
complex anymore as areas of positive polarity have disappeared from the western
edge of the main penumbra.
June 28-30: No partly or fully Earth directed CMEs were detected in LASCO imagery.
Coronal hole history (since late October 2002)
Compare today's report to the situation one solar rotation ago:
28 days ago
27 days ago
26 days ago
A recurrent trans equatorial coronal hole (CH230) will be in an Earth facing position on July 2-3.
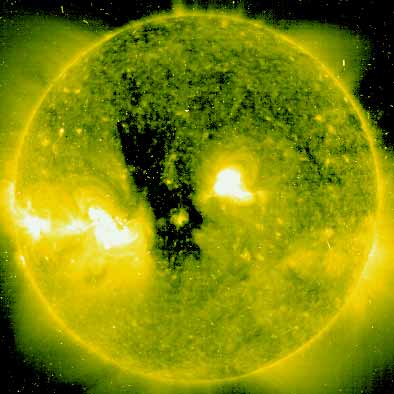
Processed SOHO/EIT 284 image at 01:06 UTC on July 2. The darkest areas on the solar disk are likely coronal holes.
The geomagnetic field is expected to be mostly quiet on July 2-3 and become unsettled to minor storm from late on July 4 until July 6 due to a high speed stream from CH230.
| Coronal holes (1) | Coronal mass ejections (2) | M and X class flares (3) |
1) Effects from a coronal hole could reach Earth
within the next 5 days. When the high speed stream has arrived the color changes to green.
2) Effects from a CME are likely to be observed at Earth within 96 hours.
3) There is a possibility of either M or X class flares within the next 48 hours.
Green: 0-20% probability, Yellow: 20-60% probability, Red: 60-100% probability.
Long distance low and medium frequency (below 2 MHz) propagation along east-west paths over high and upper middle latitudes is poor. Propagation on long distance northeast-southwest paths is fair to good. Trans Atlantic propagation conditions are normally monitored every night on 1470 kHz. Radio Cristal del Uruguay again had the best signal overall. Several other stations, including Radio Vibraci�n (Venezuela), were occasionally on top. Several stations from Brazil were heard on 1390 kHz and had company from Radio F� y Alegria (Venezuela) and Radio Universidad (Argentina). 850 Radio Carve was unusually good and 1190 Radio Am�rica had the best signal of the night and early morning. Usable audio was still present on several stations more than 90 minutes past LSR.
Compare to the previous day's image.
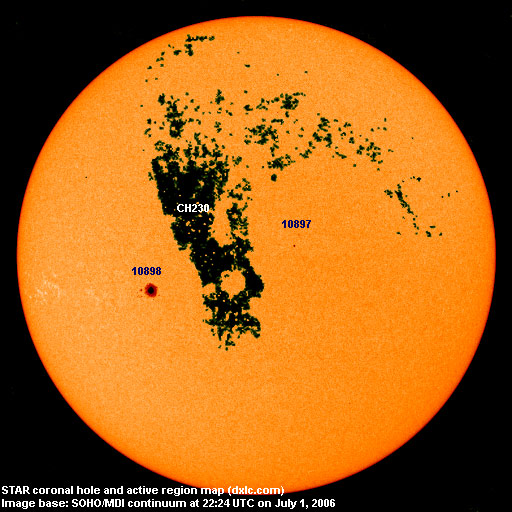
Data for all numbered solar regions according to the Solar Region Summary provided by NOAA/SEC. Comments are my own, as is the STAR spot count (spots observed at or inside a few hours before midnight) and data for regions not numbered by SEC or where SEC has observed no spots. SEC active region numbers in the table below and in the active region map above are the historic SEC/USAF numbers.
| Active region | Date numbered | SEC spot count |
STAR spot count |
Location at midnight | Area | Classification | Comment |
|---|---|---|---|---|---|---|---|
| 10897 | 2006.06.25 | 6 | 2 | N06W12 | 0030 | BXO | classification was CSO at midnight, area 0010 location: N06W09 |
| 10898 | 2006.06.28 | 10 | 11 | S06E26 | 0210 | CHO | area was 0320 at midnight |
| S666 | 2006.06.28 | N05W17 | plage | ||||
| Total spot count: | 16 | 13 | |||||
| SSN: | 36 | 33 | |||||
| Month | Average solar flux at Earth |
International sunspot number | Smoothed sunspot number |
|---|---|---|---|
| 2000.04 | 184.2 | 125.5 | 120.8 cycle 23 sunspot max. |
| 2000.07 | 202.3 | 170.1 | 119.8 |
| 2001.12 | 235.1 | 132.2 | 114.6 (-0.9) |
| 2005.05 | 99.3 | 42.7 | 28.9 (-2.7) |
| 2005.06 | 93.7 | 39.3 | 28.8 (-0.1) |
| 2005.07 | 96.4 | 40.1 | 29.1 (+0.3) |
| 2005.08 | 90.5 | 36.4 | 27.4 (-1.7) |
| 2005.09 | 91.1 | 21.9 | 25.8 (-1.6) |
| 2005.10 | 77.0 | 8.5 | 25.5 (-0.3) |
| 2005.11 | 86.3 | 18.0 | 24.9 (-0.6) |
| 2005.12 | 90.7 | 41.2 | 23.0 (-1.9) |
| 2006.01 | 83.4 | 15.4 | (20.7 predicted, -2.3) |
| 2006.02 | 76.5 | 4.7 | (18.2 predicted, -2.5) |
| 2006.03 | 75.4 | 10.8 | (16.4 predicted, -1.8) |
| 2006.04 | 89.0 | 30.2 | (15.7 predicted, -0.7) |
| 2006.05 | 80.9 | 22.2 | (14.9 predicted, -0.8) |
| 2006.06 | 76.5 | 13.9 | (12.7 predicted, -2.2) |
| 2006.07 | 85.5 (1) | 1.2 (2) | (11.3 predicted, -1.4) |
1) Running average based on the
daily 20:00 UTC observed solar flux
value at 2800 MHz.
2) Unofficial, accumulated value based on the Boulder (NOAA/SEC)
sunspot number. The official international sunspot number is typically
30-50% lower.
This report has been prepared by Jan Alvestad. It is based partly on my own observations and analysis, and partly on data from some of these solar data sources. All time references are to the UTC day. Comments and suggestions are always welcome.
| [DX-Listeners' Club] |