
Last major update issued on July 7, 2006 at 04:05 UTC.
[Solar and
geomagnetic data - last month (updated daily)]
[Solar wind and
electron fluence charts (updated daily)]
[Solar cycles 21-23
(last update June 7, 2006)]
[Solar cycles 1-20]
[Graphical comparison
of cycles 21, 22 and 23 (last update June 7, 2006)]
[Graphical
comparison of cycles 2, 10, 13, 17, 20 and 23 (last update June 7, 2006)]
[Historical solar and
geomagnetic data charts 1954-2005 (last update March 3, 2006)]
[Archived reports (last update
June 5, 2006)]
The geomagnetic field was quiet to active on July 6. Solar wind speed ranged between 540 and 695 km/s (all day average 567 km/s - decreasing 41 km/s from the previous day) under the declining influence of a high speed stream from CH230.
Solar flux measured at 20h UTC on 2.8 GHz was 85.0. The planetary A index
was 11 (STAR Ap - based on the mean of three hour interval ap
indices: 10.8).
Three hour interval K indices: 43331122 (planetary), 42332212 (Boulder).
The background x-ray flux is at the class A8 level.
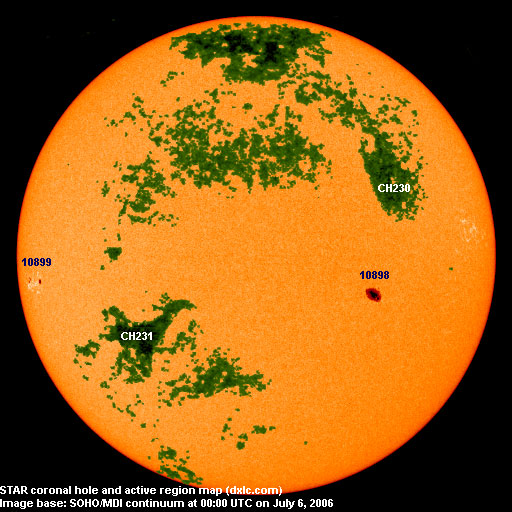
At midnight there were 2 spotted regions on the visible solar disk. The solar flare activity level was moderate. A total of 1 M class event was recorded during the day.
Region 10898 had the central umbra fragmenting further with a new
penumbra in the southern part splitting off from the main penumbra. C flares are
possible and there is a small chance of another M class flare. Flare:
M2.5/2F flare at 08:36 UTC. This event was
associated with type II and IV radio sweeps and a minor proton enhancement.
Region 10899 was mostly unchanged and quiet.
July 4-5: No partly or fully Earth directed CMEs were detected in
LASCO
imagery.
July 6: A large full halo CME was observed after the M2 event in region
10898. While the core of this CME is not likely to reach Earth, some of the
ejected material is heading our way and could reach Earth late on July 8 or
sometine on July 9.
Coronal hole history (since late October 2002)
Compare today's report to the situation one solar rotation ago:
28 days ago
27 days ago
26 days ago
A recurrent coronal hole (CH231) in the southern hemisphere will likely rotate into an Earth facing location on July 7-9.

Processed SOHO/EIT 284 image at 01:06 UTC on July 7. The darkest areas on the solar disk are likely coronal holes.
The geomagnetic field is expected to be mostly quiet on July 7-8. CME effects are possible from late on July 8 until July 10 with unsettled to minor storm conditions likely. A high speed stream from CH231 will probable dominate the solar wind on July 10-12 and cause quiet to minor storm conditions.
| Coronal holes (1) | Coronal mass ejections (2) | M and X class flares (3) |
1) Effects from a coronal hole could reach Earth
within the next 5 days. When the high speed stream has arrived the color changes to green.
2) Effects from a CME are likely to be observed at Earth within 96 hours.
3) There is a possibility of either M or X class flares within the next 48 hours.
Green: 0-20% probability, Yellow: 20-60% probability, Red: 60-100% probability.
Long distance low and medium frequency (below 2 MHz) propagation along east-west paths over high and upper middle latitudes is poor. Propagation on long distance northeast-southwest paths is fair to good. Trans Atlantic propagation conditions are normally monitored every night on 1470 kHz. Radio Cristal del Uruguay, Radio Vibración and at least two other stations were all audible. There were a number of stations from Brazil (both stations on 1280 kHz, 2 on 1290 and 1300 kHz and 1 each on 1310 and 1320 kHz to mention a few), Uruguay (best signals from 930 Montecarlo and 1410 AM Libre) and Argentina on other frequencies, even a few stations from Chile and Venezuela could be heard.
Compare to the previous day's image.
Data for all numbered solar regions according to the Solar Region Summary provided by NOAA/SEC. Comments are my own, as is the STAR spot count (spots observed at or inside a few hours before midnight) and data for regions not numbered by SEC or where SEC has observed no spots. SEC active region numbers in the table below and in the active region map above are the historic SEC/USAF numbers.
| Active region | Date numbered | SEC spot count |
STAR spot count |
Location at midnight | Area | Classification | Comment |
|---|---|---|---|---|---|---|---|
| 10897 | 2006.06.25 | N06W75 | plage | ||||
| 10898 | 2006.06.28 | 8 | 6 | S08W41 | 0420 | CKI | |
| 10899 | 2006.07.05 | 6 | 6 | S05E56 | 0100 | DSO | |
| Total spot count: | 14 | 12 | |||||
| SSN: | 34 | 32 | |||||
| Month | Average solar flux at Earth |
International sunspot number | Smoothed sunspot number |
|---|---|---|---|
| 2000.04 | 184.2 | 125.5 | 120.8 cycle 23 sunspot max. |
| 2000.07 | 202.3 | 170.1 | 119.8 |
| 2001.12 | 235.1 | 132.2 | 114.6 (-0.9) |
| 2005.05 | 99.3 | 42.7 | 28.9 (-2.7) |
| 2005.06 | 93.7 | 39.3 | 28.8 (-0.1) |
| 2005.07 | 96.4 | 40.1 | 29.1 (+0.3) |
| 2005.08 | 90.5 | 36.4 | 27.4 (-1.7) |
| 2005.09 | 91.1 | 21.9 | 25.8 (-1.6) |
| 2005.10 | 77.0 | 8.5 | 25.5 (-0.3) |
| 2005.11 | 86.3 | 18.0 | 24.9 (-0.6) |
| 2005.12 | 90.7 | 41.2 | 23.0 (-1.9) |
| 2006.01 | 83.4 | 15.4 | (20.7 predicted, -2.3) |
| 2006.02 | 76.5 | 4.7 | (18.2 predicted, -2.5) |
| 2006.03 | 75.4 | 10.8 | (16.4 predicted, -1.8) |
| 2006.04 | 89.0 | 30.2 | (15.7 predicted, -0.7) |
| 2006.05 | 80.9 | 22.2 | (14.9 predicted, -0.8) |
| 2006.06 | 76.5 | 13.9 | (12.7 predicted, -2.2) |
| 2006.07 | 86.0 (1) | 6.8 (2) | (11.3 predicted, -1.4) |
1) Running average based on the
daily 20:00 UTC observed solar flux
value at 2800 MHz.
2) Unofficial, accumulated value based on the Boulder (NOAA/SEC)
sunspot number. The official international sunspot number is typically
30-50% lower.
This report has been prepared by Jan Alvestad. It is based partly on my own observations and analysis, and partly on data from some of these solar data sources. All time references are to the UTC day. Comments and suggestions are always welcome.
| [DX-Listeners' Club] |