
Last major update issued on November 9, 2006 at 05:15 UTC.
[Solar and
geomagnetic data - last month (updated daily)]
[Solar wind and
electron fluence charts (updated daily)]
[Solar cycles 21-23
(last update October 2, 2006)]
[Solar cycles 1-20]
[Graphical comparison
of cycles 21, 22 and 23 (last update October 2, 2006)]
[Graphical
comparison of cycles 2, 10, 13, 17, 20 and 23 (last update October 2, 2006)]
[Historical solar and
geomagnetic data charts 1954-2005 (last update March 3, 2006)]
[Archived reports (last update
October 2, 2006)]
The geomagnetic field was inactive to very quiet on November 8. Solar wind speed ranged between 274 and 311 km/s (all day average 293 km/s - decreasing 1 km/s from the previous day).
Solar flux measured at 20h UTC on 2.8 GHz was 86.4. The planetary A index was 1 (STAR Ap - based on the mean of three hour interval ap indices: 0.9). Three hour interval K indices: 00001000 (planetary), 00002000 (Boulder).
The background x-ray flux is at the class B1 level.
At midnight there were 2 spotted regions on the visible solar disk. The solar flare activity level was very low. No C class events were recorded during the day.
Region 10921 decayed slowly and quietly.
New region 10923 rotated into view late on November 7 and was numbered
the next day by NOAA/SEC. The region must have decayed over the last few days as
it is now fairly quiet and spotwise not that complex. C flares are possible.
November 6-8: No obvious partly or fully Earth directed CMEs were detected in LASCO imagery.
Coronal hole history (since late October 2002)
Compare today's report to the situation one solar rotation ago:
28 days ago
27 days ago
26 days ago
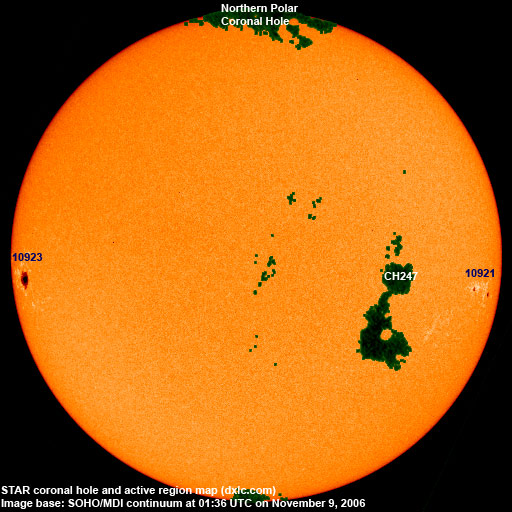
A recurrent coronal hole in the southern hemisphere, CH247, was in an Earth facing position on November 6-7. CH247 decayed on November 8 as new corona quickly filled in on the central and northern western parts.

Processed SOHO/EIT 284 image at 18:16 UTC on November 8. The darkest areas on the solar disk are likely coronal holes.
The geomagnetic field is expected to be quiet during the first half of November 9, then become quiet to active until November 11 due to a high speed stream from CH247. Quiet conditions are again likely November 12-15.
| Coronal holes (1) | Coronal mass ejections (2) | M and X class flares (3) |
1) Effects from a coronal hole could reach Earth
within the next 5 days. When the high speed stream has arrived the color changes to green.
2) Effects from a CME are likely to be observed at Earth within 96 hours.
3) There is a possibility of either M or X class flares within the next 48 hours.
Green: 0-20% probability, Yellow: 20-60% probability, Red: 60-100% probability.
Long distance low and medium frequency (below 2 MHz) propagation along east-west paths over high and upper middle latitudes is good. Propagation on long distance northeast-southwest paths is very poor.
Monitoring remarks from a location near N58E06: The first signals from North America arrived early. At 19:45 UTC 1320 CKEC had a good signal, then at 19:57 WWZN (1510) became audible with 1600 WUNR surfacing a few minutes later. Development was slow after that. 1580 CKDO and 1320 CJMR had strong signals a few minutes past 22h UTC. At 04h UTC on Nov.9 there were lots of stations to be heard, however, signals were not as strong as expected from the recent unusually quiet geomagnetic conditions.
Compare to the previous day's image.
Data for all numbered solar regions according to the Solar Region Summary provided by NOAA/SEC. Comments are my own, as is the STAR spot count (spots observed at or inside a few hours before midnight) and data for regions not numbered by SEC or where SEC has observed no spots. SEC active region numbers in the table below and in the active region map above are the historic SEC/USAF numbers.
| Active region | Date numbered | SEC spot count |
STAR spot count |
Location at midnight | Area | Classification | Comment |
|---|---|---|---|---|---|---|---|
| 10921 | 2006.10.31 | 6 | 4 | S06W66 | 0100 | DSO | |
| 10922 | 2006.10.31 | 1 | S12W50 | 0010 | AXX | spotless | |
| 10923 | 2006.11.08 | 1 | 3 | S05E71 | 0280 | HKX | formerly region S680 |
| Total spot count: | 8 | 7 | |||||
| SSN: | 38 | 27 | |||||
| Month | Average solar flux at Earth |
International sunspot number | Smoothed sunspot number |
|---|---|---|---|
| 2000.04 | 184.2 | 125.5 | 120.8 cycle 23 sunspot max. |
| 2000.07 | 202.3 | 170.1 | 119.8 |
| 2001.12 | 235.1 | 132.2 | 114.6 (-0.9) |
| 2005.08 | 90.5 | 36.4 | 27.4 (-1.7) |
| 2005.09 | 91.1 | 21.9 | 25.8 (-1.6) |
| 2005.10 | 77.0 | 8.7 | 25.5 (-0.3) |
| 2005.11 | 86.3 | 18.0 | 24.9 (-0.6) |
| 2005.12 | 90.7 | 41.1 | 23.0 (-1.9) |
| 2006.01 | 83.4 | 15.3 | 20.8 (-2.2) |
| 2006.02 | 76.5 | 4.9 | 18.6 (-2.2) |
| 2006.03 | 75.4 | 10.6 | 17.3 (-1.3) |
| 2006.04 | 89.0 | 30.2 | 17.1 (-0.2) |
| 2006.05 | 80.9 | 22.2 | (16.8 predicted, -0.3) |
| 2006.06 | 76.5 | 13.9 | (15.1 predicted, -1.7) |
| 2006.07 | 75.7 | 12.2 | (13.2 predicted, -1.9) |
| 2006.08 | 79.0 | 12.9 | (12.7 predicted, -0.5) |
| 2006.09 | 77.8 | 14.5 | (12.6 predicted, -0.1) |
| 2006.10 | 74.3 | 10.4 | (11.5 predicted, -1.1) |
| 2006.11 | 86.2 (1) | 12.3 (2) | (10.1 predicted, -1.4) |
1) Running average based on the
daily 20:00 UTC observed solar flux
value at 2800 MHz.
2) Unofficial, accumulated value based on the Boulder (NOAA/SEC)
sunspot number. The official international sunspot number is typically
30-50% lower.
This report has been prepared by Jan Alvestad. It is based partly on my own observations and analysis, and partly on data from some of these solar data sources. All time references are to the UTC day. Comments and suggestions are always welcome.
| [DX-Listeners' Club] |