
Last major update issued on July 11, 2007 at 04:20 UTC.
[Solar and
geomagnetic data - last month (updated daily)]
[Solar wind and
electron fluence charts (updated daily)
[Solar cycles 21-23
(last update June 3, 2007)]
[Solar cycles 1-20]
[Graphical comparison
of cycles 21, 22 and 23 (last update June 3, 2007)]
[Graphical
comparison of cycles 2, 10, 13, 17, 20 and 23 (last update June 3, 2007)]
[Historical solar and
geomagnetic data charts 1954-2006 (last update April 5, 2007)]
[Archived reports
(last update July 1, 2007)]
The geomagnetic field was quiet to unsettled on July 10. Solar wind speed ranged between 274 and 352 km/s (average speed was 299 km/s, decreasing 24 km/s from the previous day). A high speed stream from CH277 began to dominate the solar wind after 17h UTC with wind speed increasing to near 550 km/s early on July 11.
Solar flux measured at 20h UTC on 2.8 GHz was 78.1. The planetary A index was 6 (STAR Ap - based on the mean of three hour interval ap indices: 5.6). Three hour interval K indices: 10011213 (planetary), 10101213 (Boulder).
The background x-ray flux is at the class A3 level.
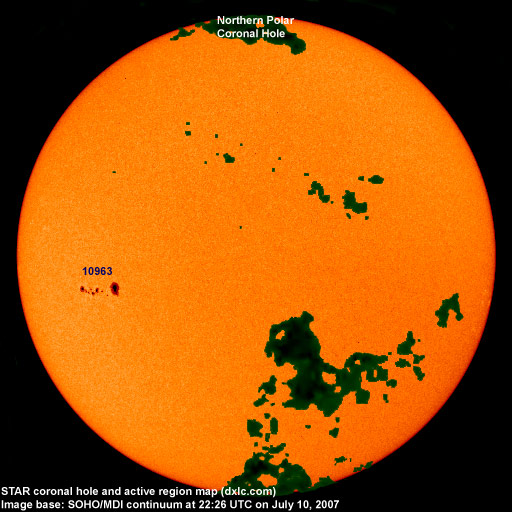
At midnight there was 1 spotted region on the visible solar disk. The solar flare activity level was low. A total of 12 C class events was recorded during the day.
Region 10963 was very active during the day and produced many C flares. A significant change occurred as the large leading negative polarity penumbra no longer is bordered by the intermediate positive polarity area. As a result the background x-ray flux has dropped quite a bit and the chance of an M class flare has decreased. Currently there is only minor polarity intermixing. Flares: C3.8/1B at 01:01, C4.3 at 01:37, C4.4/1N at 03:33, C1.2 at 05:03, C1.4 at 06:31, C7.4 at 07:21, C2.8 at 07:48, C1.9 at 11:21, C8.2 at 12:40, C5.2 at 17:53, C1.8 at 21:01 and C1.0 at 22:46 UTC.
July 8-10: No obvious fully or partly Earth directed CMEs were observed.
Coronal hole
history (since late October 2002)
Compare today's report to the situation one solar rotation ago:
28
days ago
27
days ago
26
days ago
The northwesternmost extension of a recurrent coronal hole (CH277) in the southern hemisphere was in an Earth facing position on July 6-7. The northeasternmost extension of the same coronal hole structure may have been in an Earth facing position on July 9-10.
.
Processed STEREO 195 image at 23:25 UTC on July 10. The darkest areas on the solar disk are likely coronal holes.
Long distance low and medium frequency (below 2 MHz) propagation along east-west paths over high and upper middle latitudes is very poor. Propagation on long distance northeast-southwest paths is fair.
Monitoring remarks from a location near N58E06: July 11: Some frequencies (1420, 1470, 1510 and 1520 kHz) had signals from many stations. Most of the stations heard were from Argentina, Brazil and Uruguay. Even Chile was present on 1180 kHz.
The geomagnetic field is expected to be unsettled to minor storm on July 11 and quiet to unsettled on July 12-13 due to effects from CH277.
| Coronal holes (1) | Coronal mass ejections (2) | M and X class flares (3) |
1) Effects from a coronal hole could reach Earth
within the next 5 days. When the high speed stream has arrived the
color changes to green.
2) Effects from a CME are likely to be observed at Earth within 96
hours.
3) There is a possibility of either M or X class flares within the next
48 hours.
Green: 0-20% probability, Yellow: 20-60% probability, Red: 60-100% probability.
Compare to the previous day's image.
Data for all numbered solar regions according to the Solar Region Summary provided by NOAA/SEC. Comments are my own, as is the STAR spot count (spots observed at or inside a few hours before midnight) and data for regions not numbered by SEC or where SEC has observed no spots. SEC active region numbers in the table below and in the active region map above are the historic SEC/USAF numbers.
| Active region | Date numbered | SEC spot count |
STAR spot count |
Location at midnight | Area | Classification | Comment |
|---|---|---|---|---|---|---|---|
| 10963 | 2007.07.07 | 15 | 17 | S06E40 | 0530 | EHI | beta-gamma classification was EKI at midnight |
| Total spot count: | 15 | 17 | |||||
| SSN: | 25 | 27 | |||||
| Month | Average solar flux at Earth |
International sunspot number | Smoothed sunspot number |
|---|---|---|---|
| 2000.04 | 184.2 | 125.5 | 120.8 cycle 23 sunspot max. |
| 2000.07 | 202.3 | 170.1 | 119.8 |
| 2001.12 | 235.1 | 132.2 | 114.6 (-0.9) |
| 2006.05 | 80.9 | 22.3 | 17.3 (+0.2) |
| 2006.06 | 76.5 | 13.9 | 16.3 (-1.0) |
| 2006.07 | 75.7 | 12.2 | 15.3 (-1.0) |
| 2006.08 | 79.0 | 12.9 | 15.6 (+0.3) |
| 2006.09 | 77.8 | 14.4 | 15.6 (+0.0) |
| 2006.10 | 74.3 | 10.4 | 14.2 (-1.4) |
| 2006.11 | 86.3 | 21.5 | 12.7 (-1.5) |
| 2006.12 | 84.5 | 13.6 | 12.1 (-0.6) |
| 2007.01 | 83.3 | 16.9 | (11.9 predicted, -0.2) |
| 2007.02 | 77.7 | 10.6 | (11.3 predicted, -0.6) |
| 2007.03 | 72.2 | 4.8 | (10.8 predicted, -0.5) |
| 2007.04 | 72.4 | 3.7 | (10.8 predicted, unchanged) |
| 2007.05 | 74.4 | 11.7 | (10.6 predicted, -0.2) |
| 2007.06 | 73.7 | 12.0 | (10.7 predicted, +0.1) |
| 2007.07 | 73.7 (1) | 6.1 (2) | (11.0 predicted, +0.3) |
1) Running average based on the
daily 20:00 UTC observed solar flux
value at 2800 MHz.
2) Unofficial, accumulated value based on the Boulder (NOAA/SEC)
sunspot number. The official international sunspot number is typically
30-50% lower.
This report has been prepared by Jan Alvestad. It is based partly on my own observations and analysis, and partly on data from some of these solar data sources. All time references are to the UTC day. Comments and suggestions are always welcome.
| [DX-Listeners' Club] |