
Last major update issued on May 17, 2012 at 04:45 UTC.
[Solar and geomagnetic data - last month (updated
daily)]
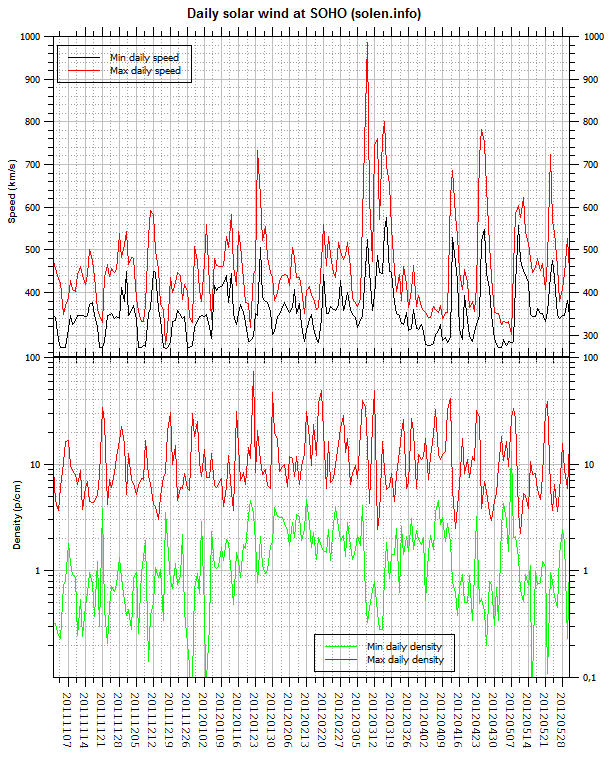
[Solar wind and
electron fluence charts (updated
daily)
[Solar cycles 21-24 (last update
May 3, 2012)]
[Solar cycles 1-20]
[Graphical comparison of cycles 21, 22, 23 and 24 (last
update May 3, 2012)]
[Graphical comparison of cycles 10, 12, 13, 14, 16 and
24 (last update May 3, 2012)]
[Historical solar and geomagnetic data charts 1954-2006
(last update April 5, 2007)]
[Archived reports since January 2003 (last update
May 3, 2012)]
[POES auroral activity level since October
2009 - updated May 12, 2012]
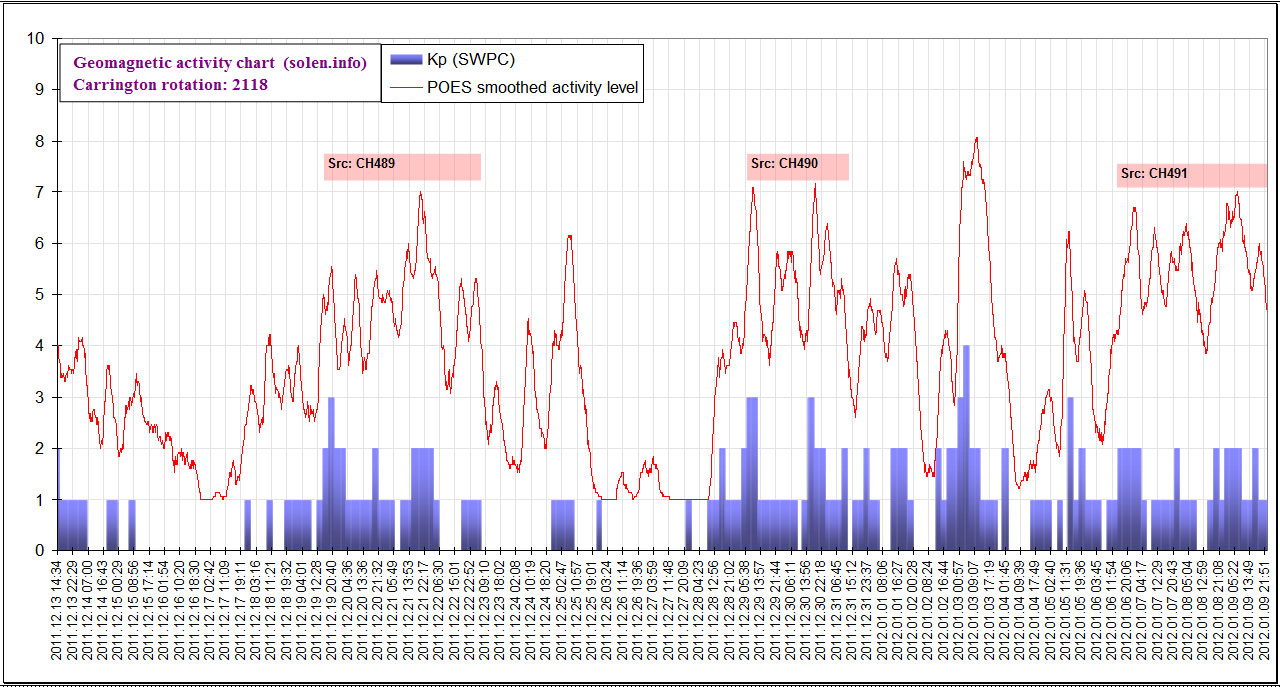
Annotated geomagnetic activity charts - Carrington rotation
2118 [December 2011 - January 2012] -
2119 [January-February
2012]
[Solar polar fields vs solar cycles - updated
June 27, 2011]
The geomagnetic field was quiet to active on May 16. Solar wind speed at SOHO ranged between 344 and 447 km/s. A minor magnetic cloud arrived near noon in the trailing part of the CME which reached Earth on May 15. This caused an increase in disturbance levels during the latter half of the day.
Solar flux measured at 20h UTC on 2.8 GHz was 130.9 (decreasing 6.9 over the last solar rotation). The Potsdam WDC planetary A index was 11 (STAR Ap - based on the mean of three hour interval ap indices: 11.1). Three hour interval K indices: 22212234 (planetary), 21112224 (Boulder).
The background x-ray flux is at the class B5 level.
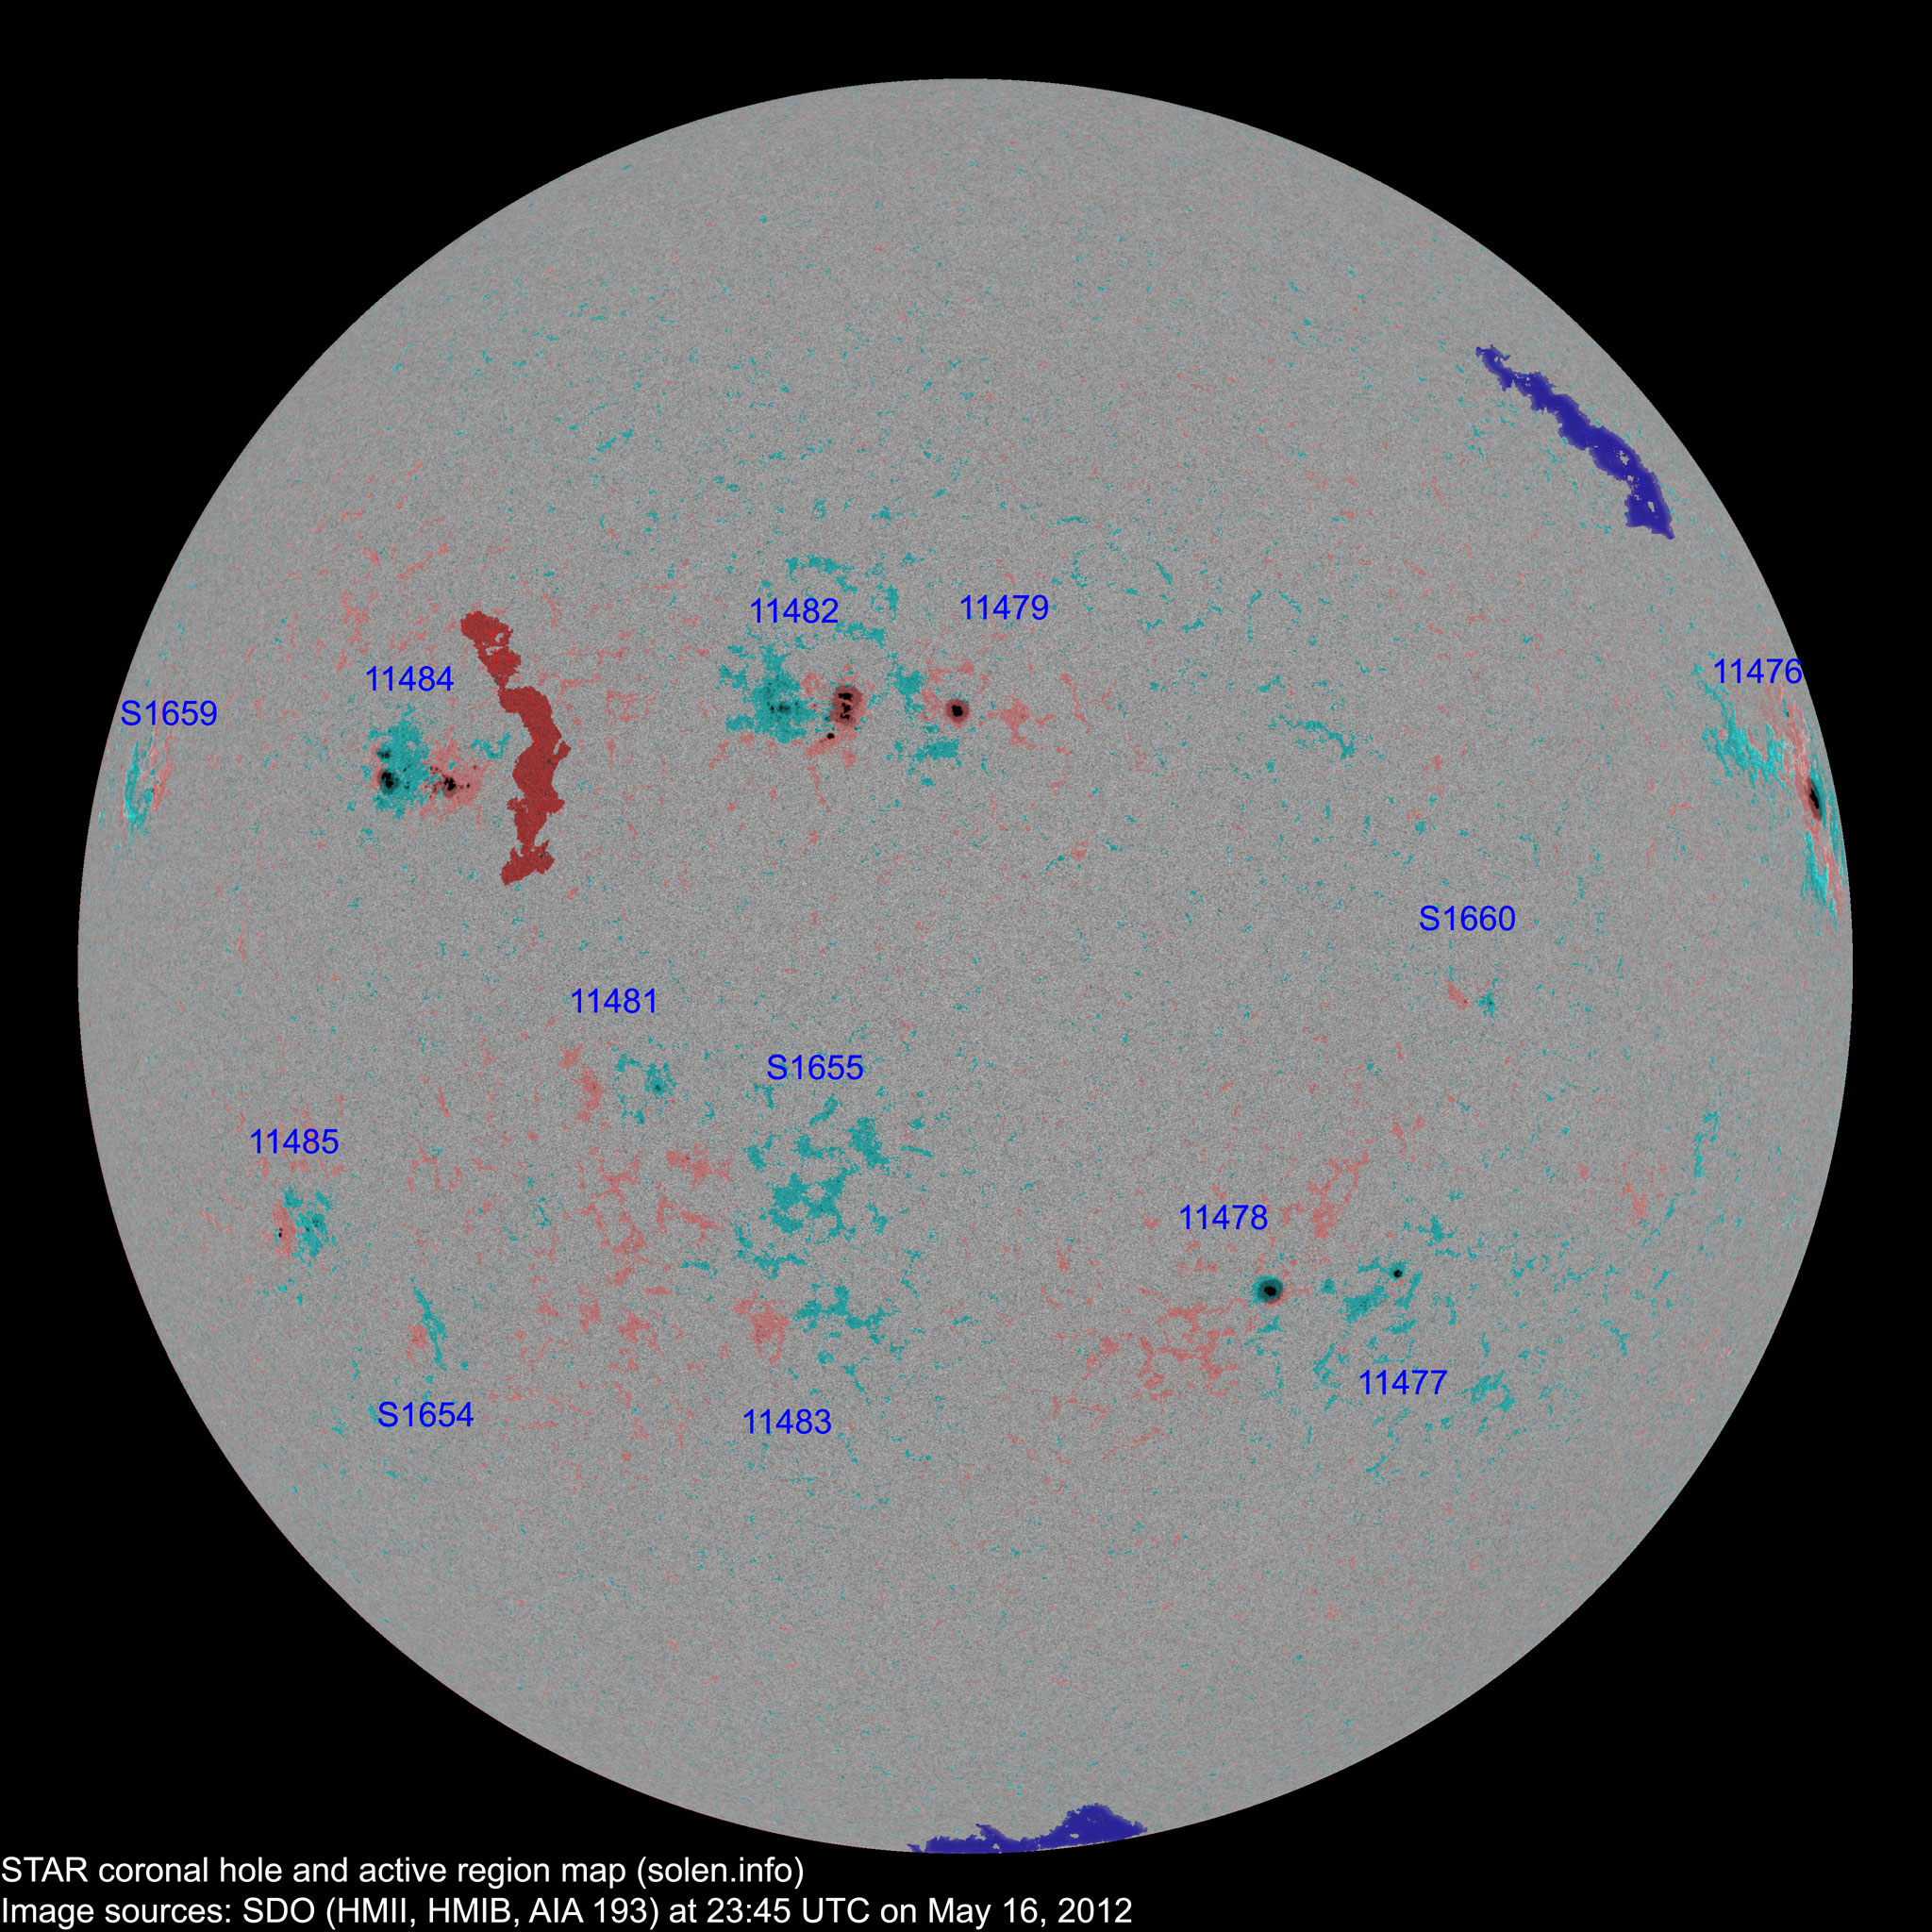
At midnight UTC the visible solar disk had 13 spotted active regions (in 2K resolution SDO images).
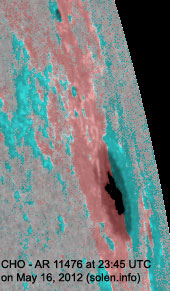
Region 11476 [N10W76] decayed further as it approached the west limb.
Early on May 17 the region produced a major M5.1 long duration proton event
peaking at 01:47 UTC. It is too early to tell if the associated CME has any
Earth directed components.
Region 11477 [S23W31] decayed slowly and quietly.
Region 11478 [S25W22] was quiet and stable.
Region 11479 [N13E01] was quiet and stable.
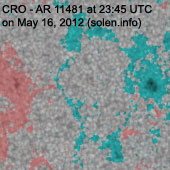
Region 11481 [S11E23] was quiet and stable.
Region 11482 [N13E09] developed further and could produce C flares.
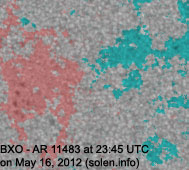
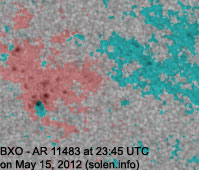
Region 11483 [S27E13] decayed quickly and quietly.
Region 11484 [N09E38] developed slowly and could produce further C class flares.
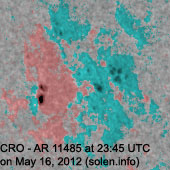
Region 11485 [S19E53] displayed no major changes and was quiet.
Spotted active regions not numbered by NOAA/SWPC:
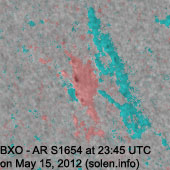
S1654 [S27E44] decayed slowly and quietly.
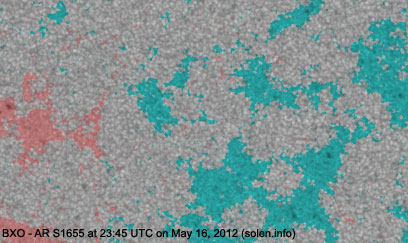
S1655 [S17E12] was quiet and stable.
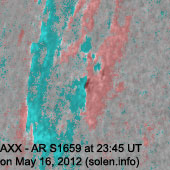
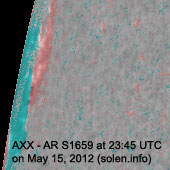
S1659 [N10E68] was quiet and stable.
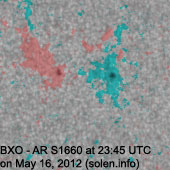
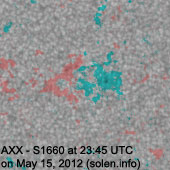
S1660 [S05W35] developed slowly and quietly.
May 14-16: No obviously Earth directed CMEs were observed in LASCO or STEREO imagery.
Coronal hole history (since October
2002)
Compare today's report to the situation one solar rotation ago:
28 days ago
27 days ago
26 days ago
No significant coronal holes are currently in or near Earth facing positions.
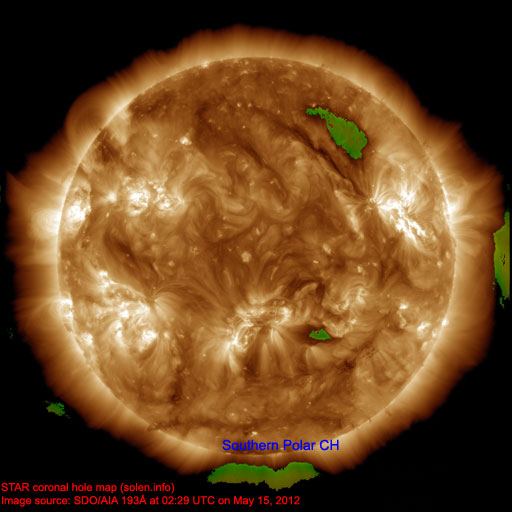
The above coronal hole map is based on a method where coronal holes are detected automatically. While the method may need some fine tuning, it has significant advantages over detecting coronal holes manually. The main improvement is the ability to detect coronal holes at and just beyond the solar limbs. Early results using this method for SDO images over a span of several weeks indicate a good match between coronal holes observed over the visible disk and their extent and position at the east and west limbs. Note that the polar coronal holes are easily detected using this method, the extent and intensity of both CHs are consistent with other data sources.
Long distance low and medium frequency (below 2 MHz) propagation along paths north of due west over high and upper middle latitudes is poor to very poor. Propagation on long distance northeast-southwest paths is fair.
The geomagnetic field is expected to be mostly quiet on May 17-19.
| Coronal holes (1) | Coronal mass ejection (2) | M and X class flares (3) |
1) Effects from a coronal hole could reach Earth within the
next 5 days. When the high speed stream has arrived the color changes to
green.
2) Effects from a CME are likely to be observed at Earth within 96 hours.
3) There is a possibility of either M or X class flares within the next 48
hours.
Green: 0-20% probability, Yellow: 20-60% probability, Red: 60-100% probability.
Click on image for higher resolution image) Compare to the previous day's image
When available the active region map has a coronal hole polarity overlay where red (pink) is negative and blue (blue-green) is positive.
Data for all numbered solar regions according to the Solar Region Summary provided by NOAA/SWPC. Comments are my own, as is the STAR spot count (spots observed at or inside a few hours before midnight) and data for regions not numbered by SWPC or where SWPC has observed no spots. SWPC active region numbers in the table below and in the active region map above are the historic SWPC/USAF numbers.
| Active region | Date numbered detected |
Spot count | Location at midnight | Area | Classification | SDO / HMI 4K continuum image with magnetic polarity overlay |
Comment | ||||
|---|---|---|---|---|---|---|---|---|---|---|---|
| SWPC | STAR SDO | SWPC | STAR | Current | Previous | ||||||
| 2K | 1K | ||||||||||
| 11476 | 2012.05.04 2012.05.05 |
3 | 4 | 3 | N13W73 | 0230 | CAO | CHO |
 |
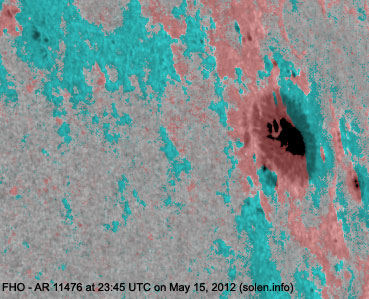 |
location: N10W76 area: 0350 |
| 11477 | 2012.05.07 2012.05.08 |
1 | 9 | 3 | S21W32 | 0010 | AXX | HRX |
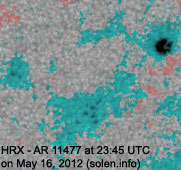 |
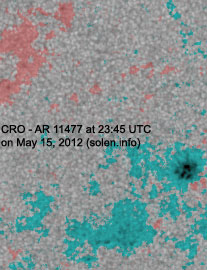 |
location: S23W31 |
| 11478 | 2012.05.08 2012.05.10 |
1 | 1 | 1 | S22W23 | 0060 | HSX | HSX |
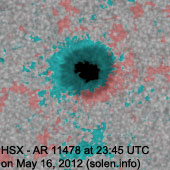 |
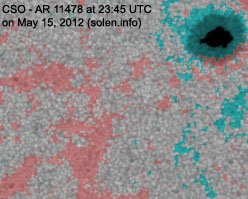 |
area: 0120 location: S25W22 |
| S1642 | 2012.05.09 | S18W52 |
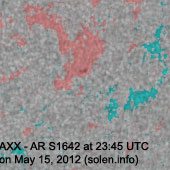 |
plage | |||||||
| 11479 | 2012.05.10 2012.05.11 |
3 | 5 | 4 | N10E01 | 0050 | CSO | CSO |
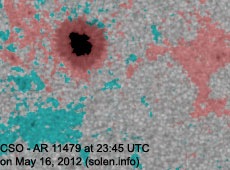 |
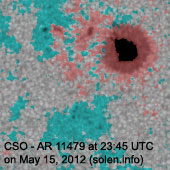 |
area: 0100 location: N13E01 |
| S1645 | 2012.05.10 | S12W56 | plage | ||||||||
| 11482 | 2012.05.11 2012.05.13 |
9 | 29 | 13 | N13E10 | 0130 | CAO | DKI |
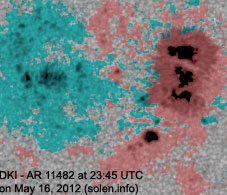 |
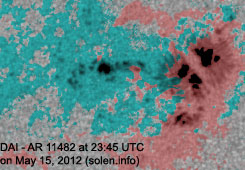 |
area: 0350 |
| S1647 | 2012.05.11 | N13W24 | plage | ||||||||
| 11483 | 2012.05.12 2012.05.13 |
1 | 5 | S26E13 | 0010 | AXX | BXO |
 |
 |
||
| 11481 | 2012.05.12 2012.05.13 |
1 | 3 | 2 | S10E19 | 0010 | AXX | CRO |
 |
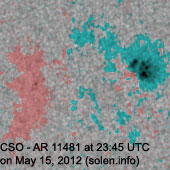 |
location: S11E23 |
| 11484 | 2012.05.13 | 9 | 30 | 16 | N09E38 | 0120 | DAO | DAI |
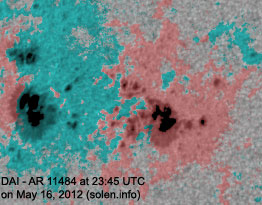 |
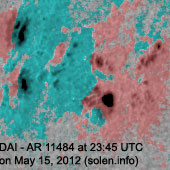 |
area: 0300 |
| S1651 | 2012.05.13 | N31E01 | plage | ||||||||
| S1652 | 2012.05.13 | S03W44 | plage | ||||||||
| S1653 | 2012.05.13 | N28W36 | plage | ||||||||
| S1654 | 2012.05.14 | 4 | S27E44 | 0000 | BXO |
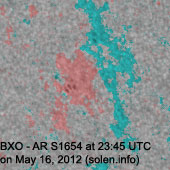 |
 |
||||
| S1655 | 2012.05.14 | 6 | 3 | S17E12 | 0000 | BXO |
 |
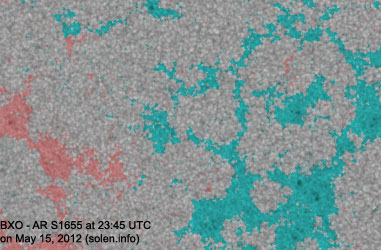 |
count includes 1 spot outside of image | ||
| S1656 | 2012.05.14 | S32W43 | plage | ||||||||
| S1657 | 2012.05.14 | S22W58 | plage | ||||||||
| S1659 | 2012.05.15 | 1 | 1 | N10E68 | 0000 | AXX |
 |
 |
|||
| S1660 | 2012.05.15 | 2 | 2 | S05W35 | 0010 | BXO |
 |
 |
|||
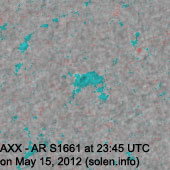
| S1661 | 2012.05.15 | N33E29 |
 |
plage | |||||||
| 11485 | 2012.05.15 | 4 | 10 | 5 | S20E51 | 0010 | BXO | CRO |
 |
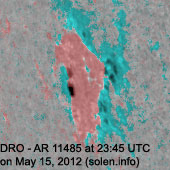 |
location: S19E53 area: 0020 |
| Total spot count: | 32 | 109 | 53 | ||||||||
| Sunspot number: | 122 | 239 | 163 | (total spot count + 10 * number of spotted regions) | |||||||
| Weighted penumbral SN: | 70 | 153 | 97 | (Sum of total spot count + classification weighting for each AR. Classification weighting: X=0, R=3, A/S=5, H/K=10) | |||||||
| Relative sunspot number (Wolf number): | 73 | 84 | 90 | k * (sunspot number). k = 0.6 for SWPC, k = 0.35 (changed from 0.45 on March 1, 2011) for STAR SDO 2K, k = 0.55 for STAR SDO 1K | |||||||
| Month | Average measured solar flux | International sunspot number (SIDC) | Smoothed sunspot number | Average ap (3) |
|---|---|---|---|---|
| 2008.07 | 65.7 (SF minimum) | 0.5 | 2.8 (-0.4) | |
| 2008.12 | 69.2 | 0.8 | 1.7 (-) sunspot minimum |
|
| 2011.02 | 94.6 | 29.4 | 33.4 (+2.4) | 6.44 |
| 2011.03 | 115.0 | 56.2 | 36.9 (+3.5) | 8.18 |
| 2011.04 | 112.6 | 54.4 | 41.8 (+4.9) | 8.83 |
| 2011.05 | 95.8 | 41.6 | 47.6 (+5.8) | 8.94 |
| 2011.06 | 95.8 | 37.0 | 53.2 (+5.6) | 8.06 |
| 2011.07 | 94.2 | 43.9 | 57.2 (+4.0) | 8.16 |
| 2011.08 | 101.7 | 50.6 | 59.0 (+1.8) | 7.26 |
| 2011.09 | 133.8 | 78.0 | 59.5 (+0.5) | 12.27 |
| 2011.10 | 137.3 | 88.0 | 59.9 (+0.4) | 8.28 |
| 2011.11 | 153.5 | 96.7 | (61.2 projected, +1.3) | 5.55 |
| 2011.12 | 141.3 | 73.0 | (63.9 projected, +2.7) | 3.78 |
| 2012.01 | 132.5 | 58.3 | (67.4 projected, +3.5) | 7.15 |
| 2012.02 | 106.5 | 33.1 | (71.4 projected, +4.0) | 8.81 |
| 2012.03 | 114.7 | 64.2 | (73.5 projected, +2.1) | 16.08 |
| 2012.04 | 113.0 | 55.2 | (74.5 projected, +1.0) | 10.10 |
| 2012.05 | 123.5 (1) | 54.1 (2A) / 104.8 (2B) | (75.8 projected, +1.3) | (10.14) |
1) Running average based on the daily 20:00 UTC observed solar flux value at
2800 MHz.
2A) Current impact on the monthly sunspot number based on the Boulder
(NOAA/SWPC) sunspot number (accumulated daily sunspots / month days). The
official SIDC international sunspot number is typically 30-50% lower. 2B) Month
average to date.
3) Running average based on the quicklook and definitive Potsdam WDC ap indices.
Values in red are based on the definitive
international Potsdam
WDC
ap indices.
This report has been prepared by Jan Alvestad. It is based on analysis of data from whatever sources are available at the time the report is prepared. All time references are to the UTC day. Comments and suggestions are always welcome.
SDO images are courtesy of NASA/SDO and the AIA, EVE, and HMI science teams.