
Last major update issued on January 9, 2013 at 05:50 UTC.
[Solar and geomagnetic data - last month (updated
daily)]
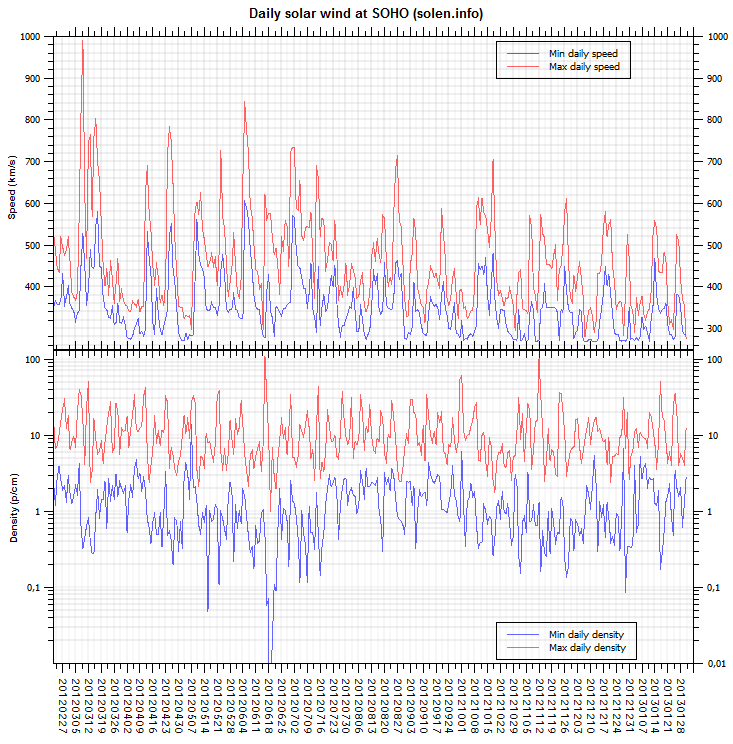
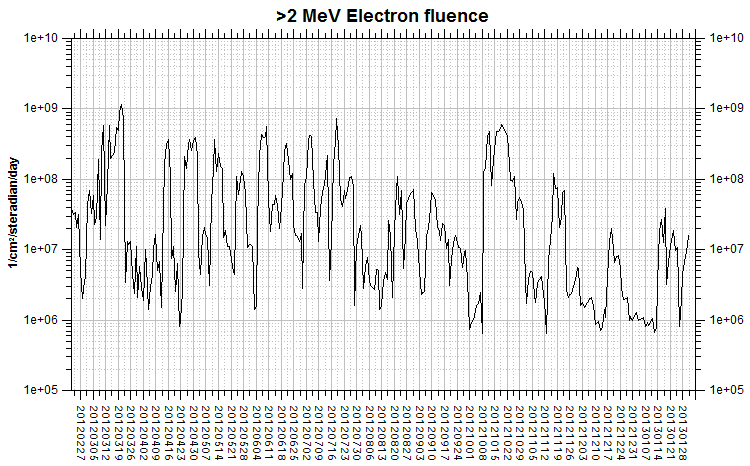
[Solar wind and
electron fluence charts (updated
daily)]
[Solar cycles 23-24 (last update January 1, 2013)] [Cycle
24 progress (last update January 1, 2013) ]
[Solar cycles 1-20]
[Graphical comparison of cycles 21, 22, 23 and 24 (last
update January 1, 2013)]
[Graphical comparison of cycles 10, 12, 13, 14, 16 and
24 (last update January 1, 2013)]
[Historical solar and geomagnetic data charts 1954-2006
(last update April 5, 2007)]
[Archived reports since January 2003 (last update
January 2, 2013)]
[POES auroral activity level since October
2009 - updated October 7, 2012]
[Solar polar fields vs solar cycles - updated
January 8, 2013]
The geomagnetic field was quiet on January 8. Solar wind speed at SOHO ranged between 300 and 334 km/s, weakly under the influence of a low speed stream from CH549.
Solar flux measured at 20h UTC on 2.8 GHz was 155.6 (increasing 43.7 over the last solar rotation). The Potsdam WDC planetary A index was 4 (STAR Ap - based on the mean of three hour interval ap indices: 3.6). Three hour interval K indices: 01010112 (planetary), 01001112 (Boulder).
The background x-ray flux was at the class B7 level.
At midnight UTC the visible solar disk had 16 spotted active regions (in 2K resolution SDO images).
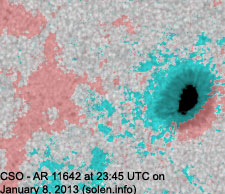
Region 11642 [S24W28] was quiet and stable.
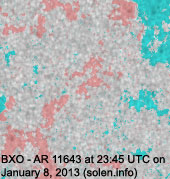
Region 11643 [S13W35] was quiet and stable.
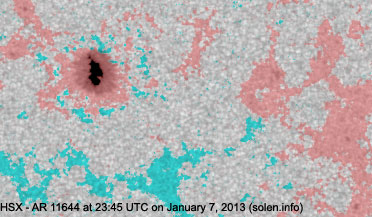
Region 11644 [N15W17] decayed slowly and quietly.
Region 11645 [S14W57] decayed slowly and quietly.
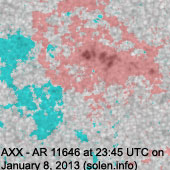
Region 11646 [N13W08] decayed very quickly as the main spot disintegrated.
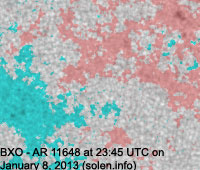
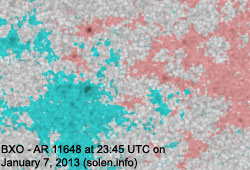
Region 11648 [N05W02] decayed slowly and quietly.
Region 11649 [S15E19] was quiet and stable.
Region 11650 [S28E27] decayed slowly and was mostly quiet.
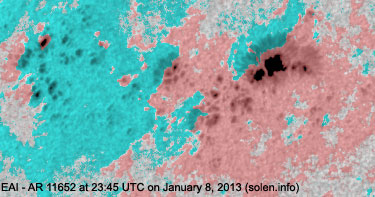
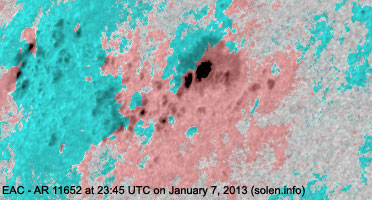
Region 11652 [N20E38] developed early in the day, then began to decay.
The region currently has no mature penumbra on any trailing spot.
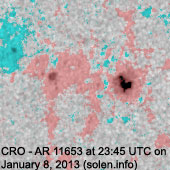
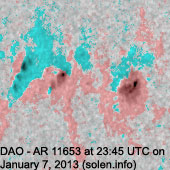
Region 11653 [N08E36] decayed slowly and was mostly quiet.
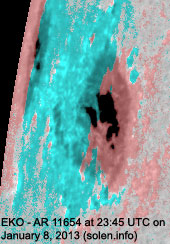
New region 11654 [N08E76] rotated fully into view revealing one of the
larger regions of solar cycle 24. The region appears to have a simple magnetic
layout, still M flares are possible.
Spotted regions not numbered by SWPC:
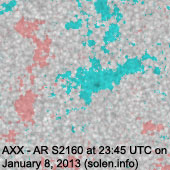
S2160 [S18W16] was quiet and stable.
S2163 [S17W03] was quiet and stable.
New region S2164 [S17E64] emerged with small spots.
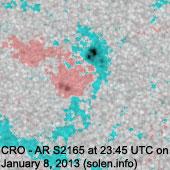
New region S2165 [S22E17] emerged with several spots.
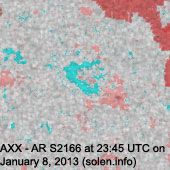
New region S2166 [N27W22] emerged with a tiny spot.
January 6-8: No obviously Earth directed CMEs were observed in LASCO and STEREO imagery.
Coronal hole history (since October
2002)
Compare today's report to the situation one solar rotation ago:
28 days ago
27 days ago
26 days ago
A small recurrent trans equatorial coronal hole (CH549) was in an Earth facing position on January 3-4.

The above coronal hole map is based on a method where coronal holes are detected automatically. While the method may need some fine tuning, it has significant advantages over detecting coronal holes manually. The main improvement is the ability to detect coronal holes at and just beyond the solar limbs. Early results using this method for SDO images over a span of several weeks indicate a good match between coronal holes observed over the visible disk and their extent and position at the east and west limbs. Note that the polar coronal holes are easily detected using this method, the extent and intensity of both CHs are consistent with other data sources.
Long distance low and medium frequency (below 2 MHz) propagation along paths north of due west over high and upper middle latitudes is fair to good. Propagation on long distance northeast-southwest paths is poor.
The geomagnetic field is expected to be quiet on January 9-11.
| Coronal holes (1) | Coronal mass ejection (2) | M and X class flares (3) |
1) Effects from a coronal hole could reach Earth within the
next 5 days. When the high speed stream has arrived the color changes to
green.
2) Effects from a CME are likely to be observed at Earth within 96 hours.
3) There is a possibility of either M or X class flares within the next 48
hours.
Green: 0-20% probability, Yellow: 20-60% probability, Red: 60-100% probability.
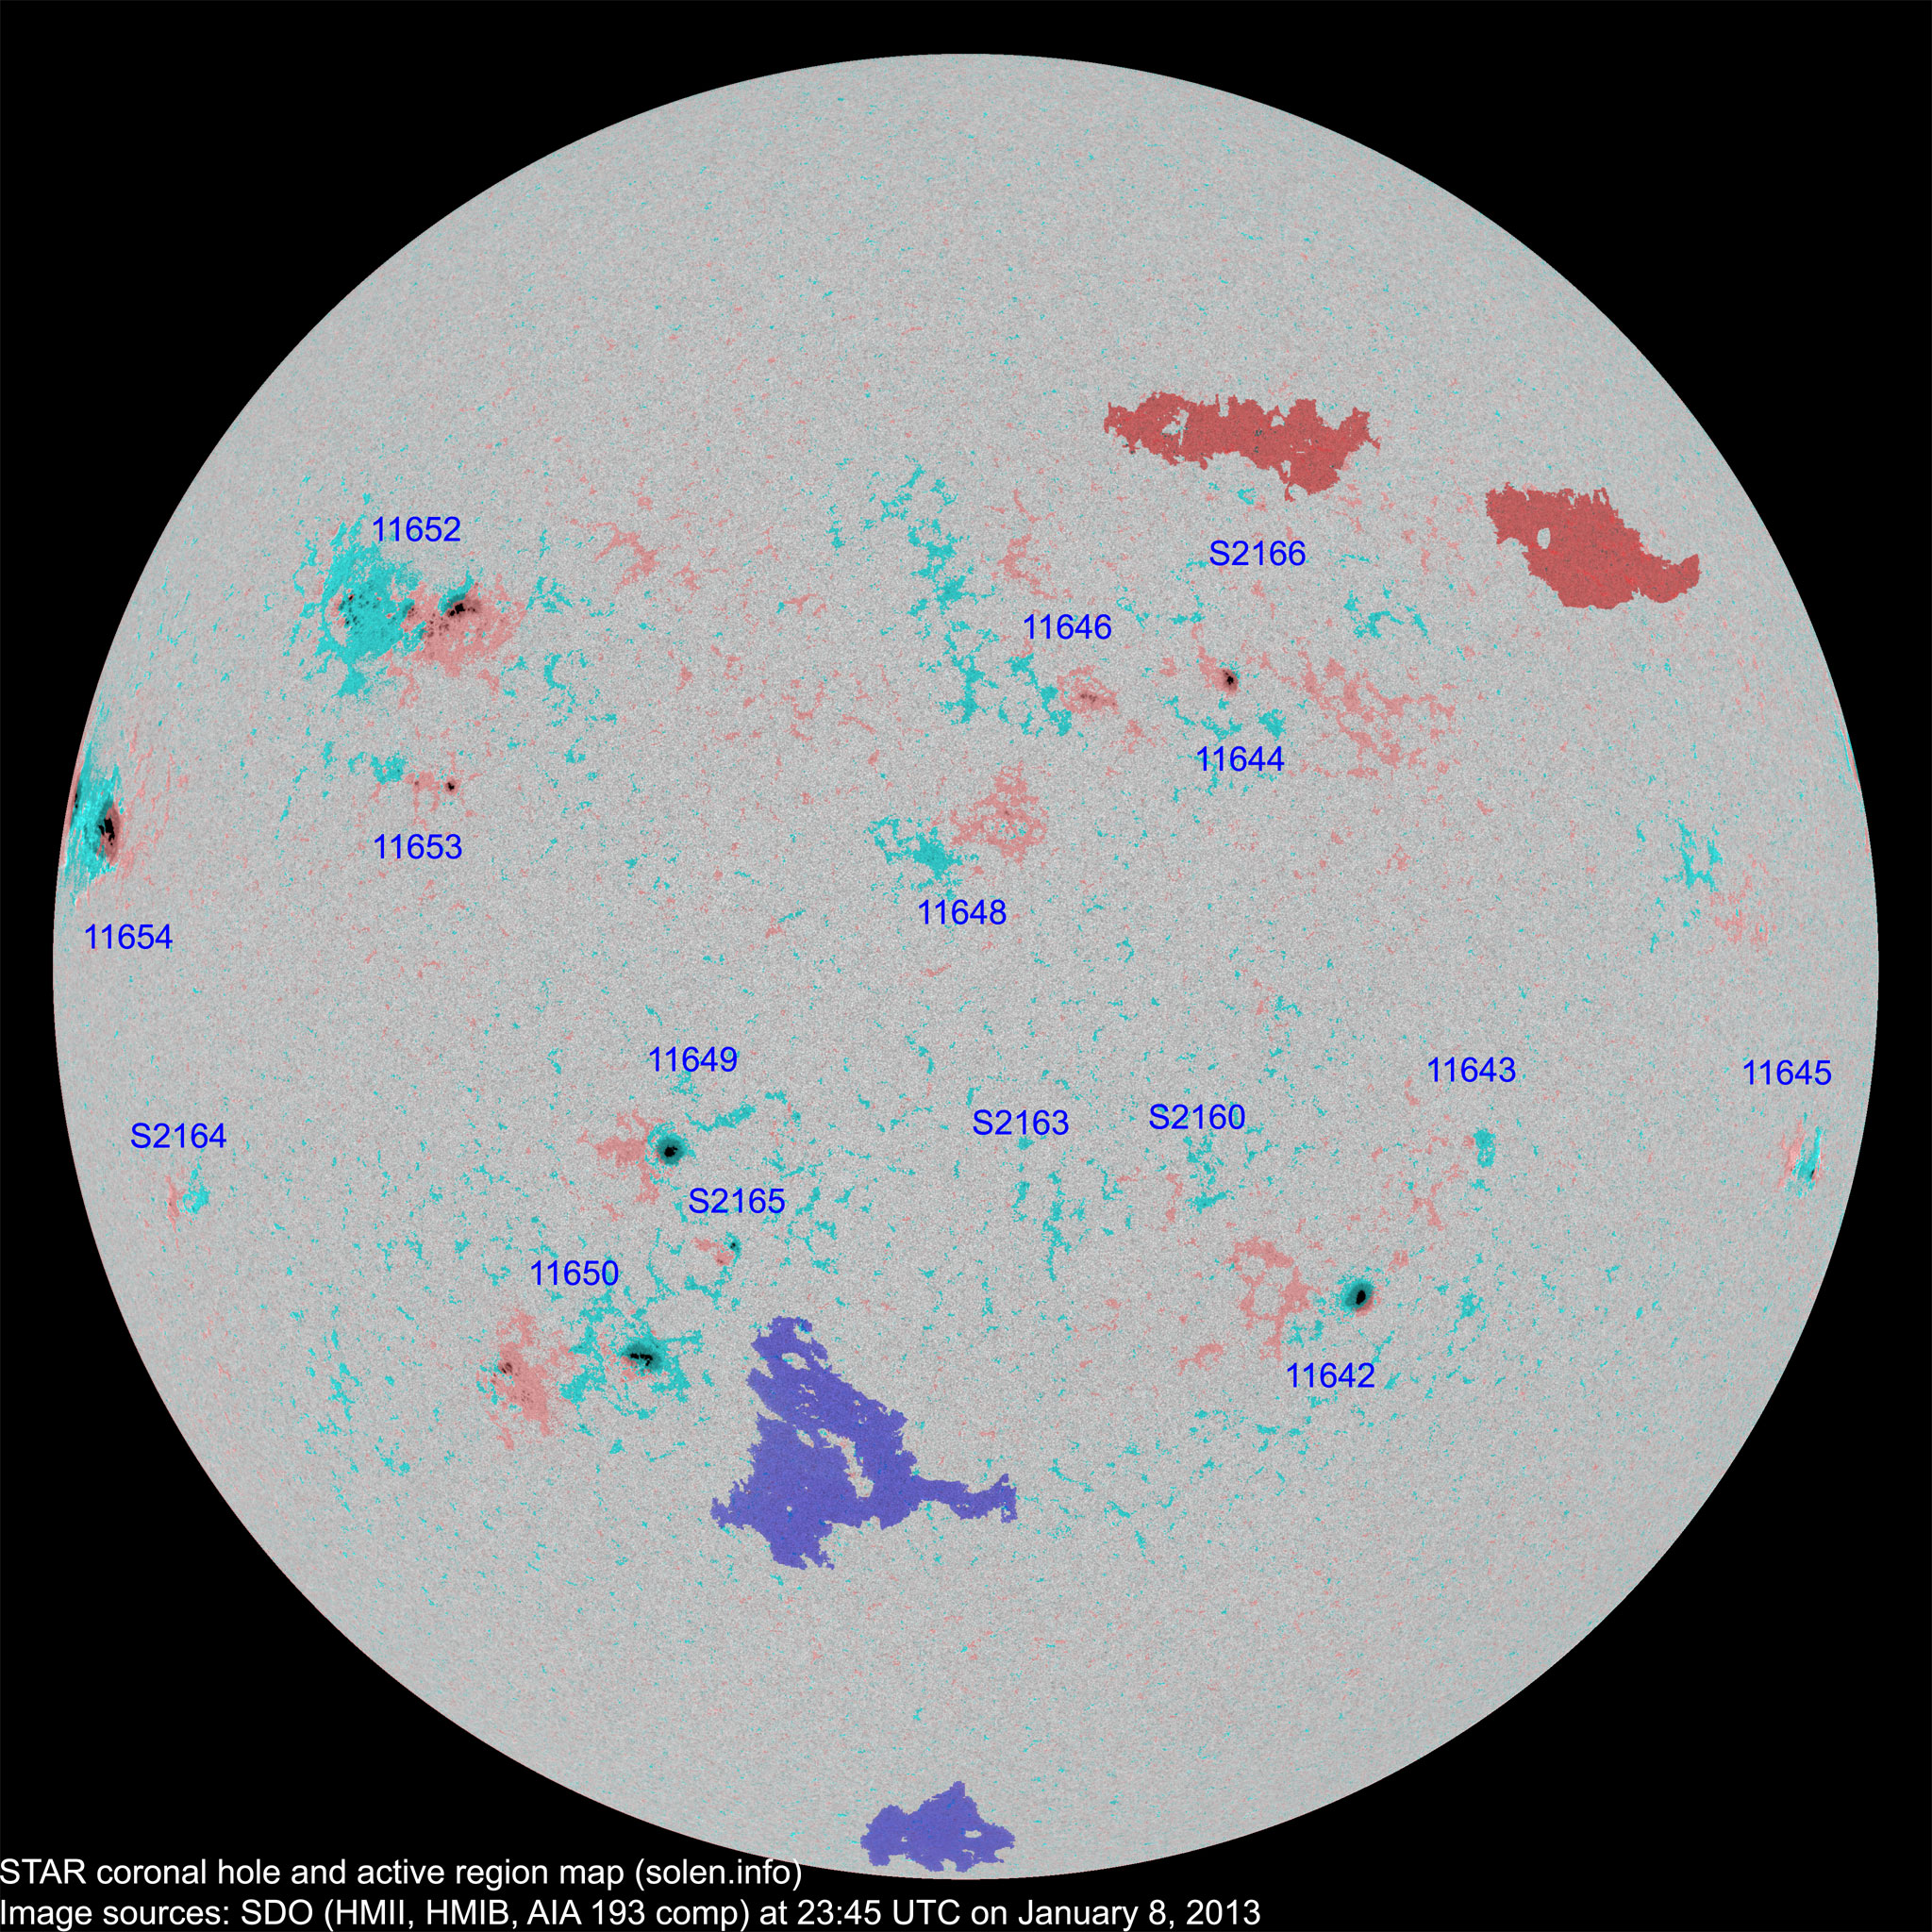
(Click on image for 2K resolution) Compare to the previous day's image. 0.5k image
When available the active region map has a coronal hole polarity overlay where red (pink) is negative and blue (blue-green) is positive.
Data for all numbered solar regions according to the Solar Region Summary provided by NOAA/SWPC. Comments are my own, as is the STAR spot count (spots observed at or inside a few hours before midnight) and data for regions not numbered by SWPC or where SWPC has observed no spots. SWPC active region numbers in the table below and in the active region map above are the historic SWPC/USAF numbers.
| Active region | Date numbered detected |
Spot count | Location at midnight | Area | Classification | SDO / HMI 4K continuum image with magnetic polarity overlay |
Comment | ||||
|---|---|---|---|---|---|---|---|---|---|---|---|
| SWPC | STAR SDO | SWPC | STAR | Current | Previous | ||||||
| 2K | 1K | ||||||||||
| 11638 | 2012.12.26 2012.12.27 |
1 | N13W87 | 0060 | HSX |
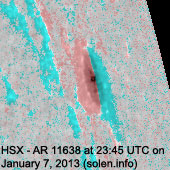 |
rotated out of view | ||||
| 11641 | 2012.12.29 2012.12.31 |
N02W59 |
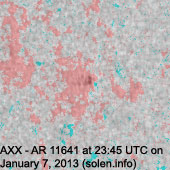 |
plage | |||||||
| 11642 | 2012.12.30 2012.12.31 |
1 | 4 | 1 | S25W29 | 0080 | HSX | CSO |
 |
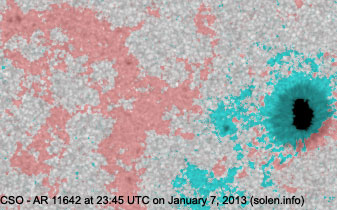 |
area: 0160 |
| 11643 | 2012.12.31 2013.01.02 |
4 | S14W39 | 0000 | AXX |
 |
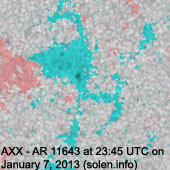 |
location: S13W35 | |||
| 11644 | 2013.01.01 2013.01.02 |
1 | 4 | 1 | N15W19 | 0040 | HAX | HAX |
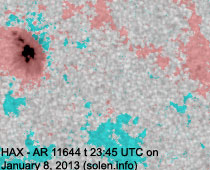 |
 |
|
| 11648 | 2013.01.02 2013.01.04 |
3 | 1 | N05W03 | 0000 | BXO |
 |
 |
|||
| 11646 | 2013.01.02 2013.01.03 |
3 | 5 | 3 | N13W09 | 0030 | HRX | AXX |
 |
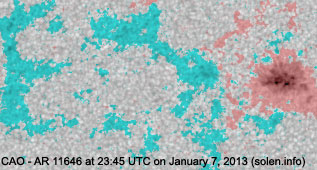 |
|
| 11651 | 2013.01.02 2013.01.04 |
N20W05 |
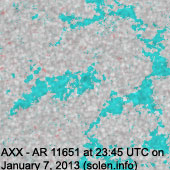 |
plage | |||||||
| 11645 | 2013.01.02 2013.01.03 |
5 | 3 | 2 | S14W72 | 0030 | CRO | CRO |
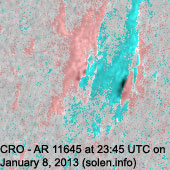 |
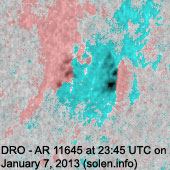 |
|
| 11649 | 2013.01.03 2013.01.04 |
1 | 3 | 1 | S15E18 | 0080 | HSX | HSX |
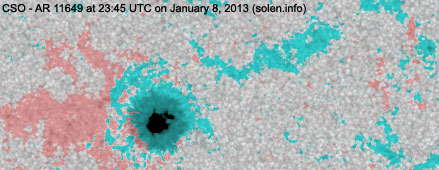 |
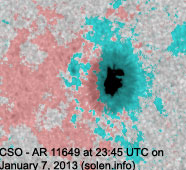 |
area: 0140 |
| S2156 | 2013.01.03 | N17W07 | plage | ||||||||
| 11650 | 2013.01.04 | 7 | 19 | 12 | S30E30 | 0120 | EAO | EAO |
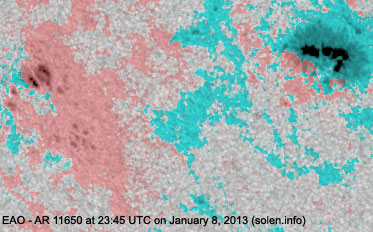 |
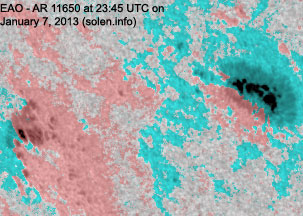 |
location: S28E27 area: 0200 |
| 11652 | 2013.01.05 | 19 | 47 | 32 | N19E38 | 0210 | FAC | EAI |
 |
 |
beta-gamma |
| 11653 | 2013.01.05 | 4 | 3 | 3 | N09E35 | 0030 | CRO | CRO |
 |
 |
|
| S2157 | 2013.01.05 | S02W10 | plage | ||||||||
| S2158 | 2013.01.05 | N15W51 | plage | ||||||||
| S2159 | 2013.01.05 | N25W33 | plage | ||||||||
| S2160 | 2013.01.06 | 1 | 1 | S18W16 | 0000 | AXX |
 |
 |
|||
| 11654 | 2013.01.07 | 2 | 12 | 6 | N08E71 | 0260 | HHX | EKO |
 |
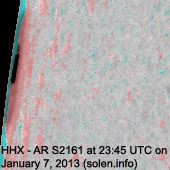 |
location: N08E76 area: 0850 |
| S2162 | 2013.01.07 | N20E12 |
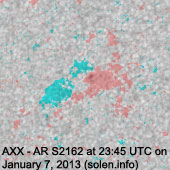 |
plage | |||||||
| S2163 | 2013.01.07 | 1 | S17W03 | 0000 | AXX |
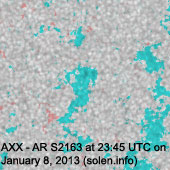 |
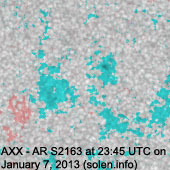 |
||||
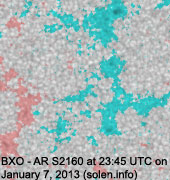
| S2164 | 2013.01.08 | 2 | 2 | S17E64 | 0000 | BXO |
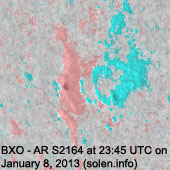 |
||||
| S2165 | 2013.01.08 | 5 | 2 | S22E17 | 0020 | CRO |
 |
||||
| S2166 | 2013.01.08 | 1 | N27W22 | 0000 | AXX |
 |
|||||
| Total spot count: | 44 | 117 | 67 | ||||||||
| Sunspot number: | 144 | 277 | 197 | (total spot count + 10 * number of spotted regions) | |||||||
| Weighted SN: | 93 | 161 | 111 | (Sum of total spot count + classification weighting for each AR. Classification weighting: X=0, R=3, A/S=5, H/K=10) | |||||||
| Relative sunspot number (Wolf number): | 86 | 97 | 108 | k * (sunspot number). k = 0.6 for SWPC, k = 0.35 for STAR SDO 2K, k = 0.55 for STAR SDO 1K | |||||||
| Month | Average measured solar flux | International sunspot number (SIDC) | Smoothed sunspot number | Average ap (3) |
|---|---|---|---|---|
| 2011.10 | 137.3 | 88.0 | 59.9 (+0.4) | 8.28 |
| 2011.11 | 153.5 (cycle max) | 96.7 (cycle max) | 61.1 (+1.2) | 5.55 |
| 2011.12 | 141.3 | 73.0 | 63.4 (+2.3) | 3.78 |
| 2012.01 | 132.5 | 58.3 | 65.5 (+2.1) | 7.15 |
| 2012.02 | 106.5 | 32.9 | 66.9 (+1.4) possible cycle 24 max |
8.81 |
| 2012.03 | 114.7 | 64.3 | 66.8 (-0.1) | 16.08 |
| 2012.04 | 113.0 | 55.2 | 64.6 (-2.2) | 10.10 |
| 2012.05 | 121.5 | 69.0 | 61.7 (-2.9) | 7.06 |
| 2012.06 | 119.6 | 64.5 | 58.9 (-2.8) | 10.08 |
| 2012.07 | 133.9 | 66.5 | (57.4 projected, -1.5) | 13.90 |
| 2012.08 | 115.4 | 63.1 | (58.3 projected, +0.9) | 7.96 |
| 2012.09 | 122.9 | 61.5 | (58.9 projected, +0.6) | 8.07 |
| 2012.10 | 123.3 | 53.3 | (58.3 projected, -0.6) | 9.97 |
| 2012.11 | 121.3 | 61.4 | (57.6 projected, -0.7) | 7.08 |
| 2012.12 | 108.6 | 40.8 | (56.9 projected, -0.7) | 3.44 |
| 2013.01 | 137.7 (1) | 38.0 (2A) / 147.4 (2B) / 56.4 (2C) | (56.2 projected, -0.7) | (2.08) |
1) Running average based on the daily 20:00 UTC observed solar flux value at
2800 MHz.
2A) Current impact on the monthly sunspot number based on the Boulder
(NOAA/SWPC) sunspot number (accumulated daily sunspots / month days). The
official SIDC international sunspot number is typically 30-50% lower. 2B)
Boulder SN current month
average to date. 2C) STAR SDO 1K Wolf number 30 day average.
3) Running average based on the quicklook and definitive Potsdam WDC ap indices.
Values in red are based on the definitive
international Potsdam
WDC
ap indices.
This report has been prepared by Jan Alvestad. It is based on analysis of data from whatever sources are available at the time the report is prepared. All time references are to the UTC day. Comments and suggestions are always welcome.
SDO images are courtesy of NASA/SDO and the AIA, EVE, and HMI science teams.