
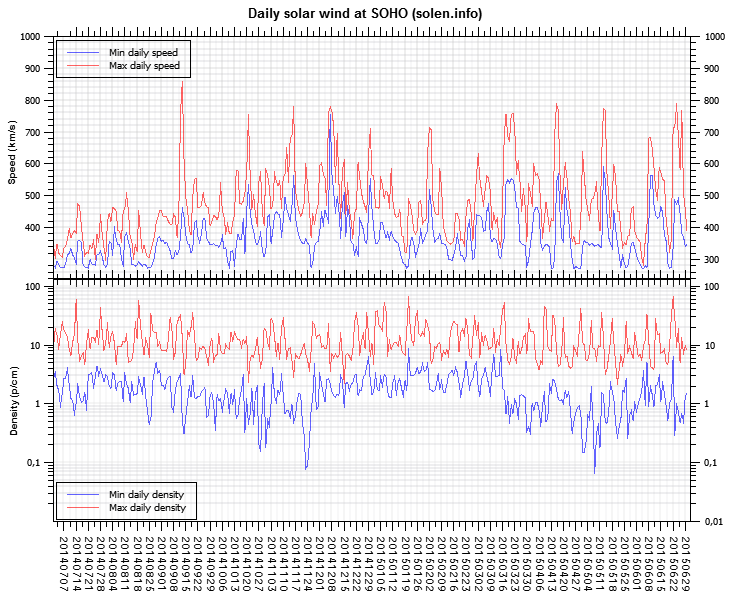
The geomagnetic field was quiet to unsettled on June 13 under the influence of a high speed stream associated with CH672. Solar wind speed at SOHO ranged between 430 and 489 km/s.
Solar flux at 20h UTC on 2.8 GHz was 136.1 (increasing 16.5 over the last solar rotation). The 90 day 10.7 flux at 1 AU was 126.6. The Potsdam WDC planetary A index was 8 (STAR Ap - based on the mean of three hour interval ap indices: 7.9). Three hour interval K indices: 32222222 (planetary), 33433323 (Boulder).
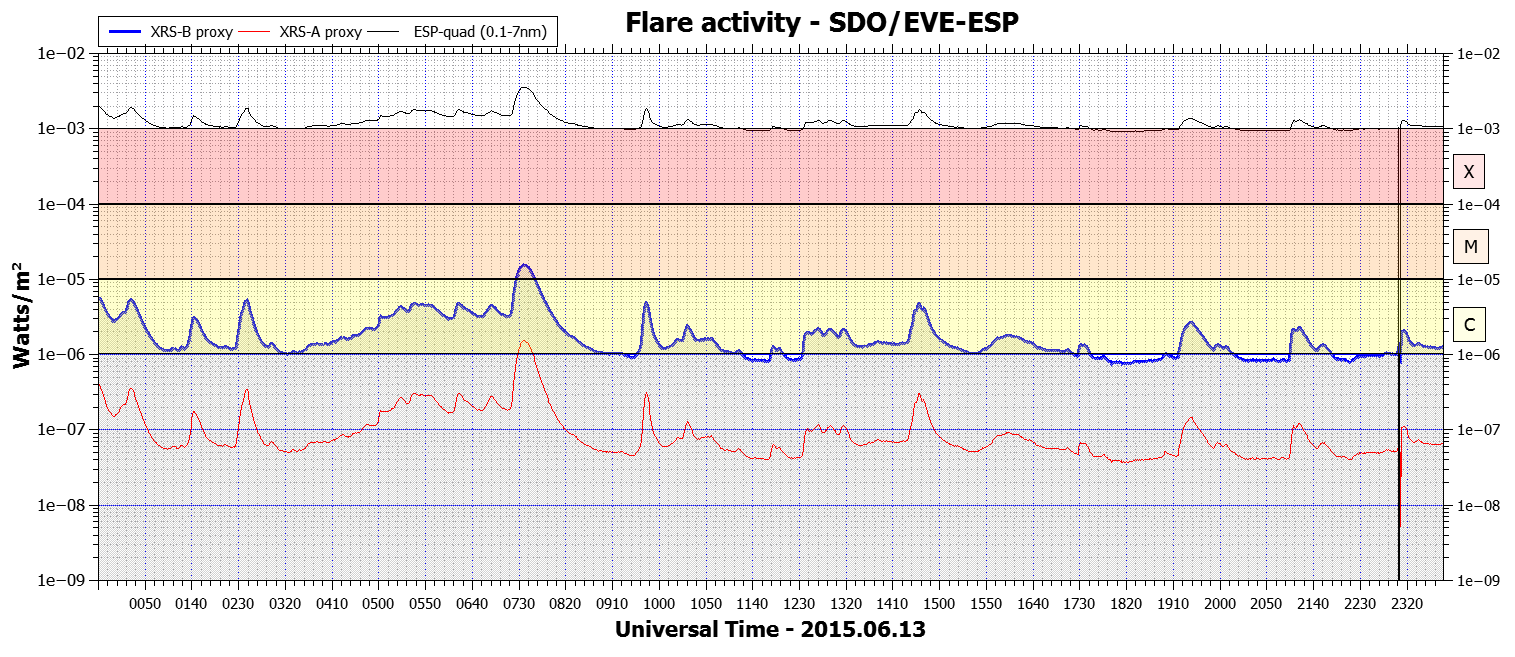
The background x-ray flux is at the class B9 level.
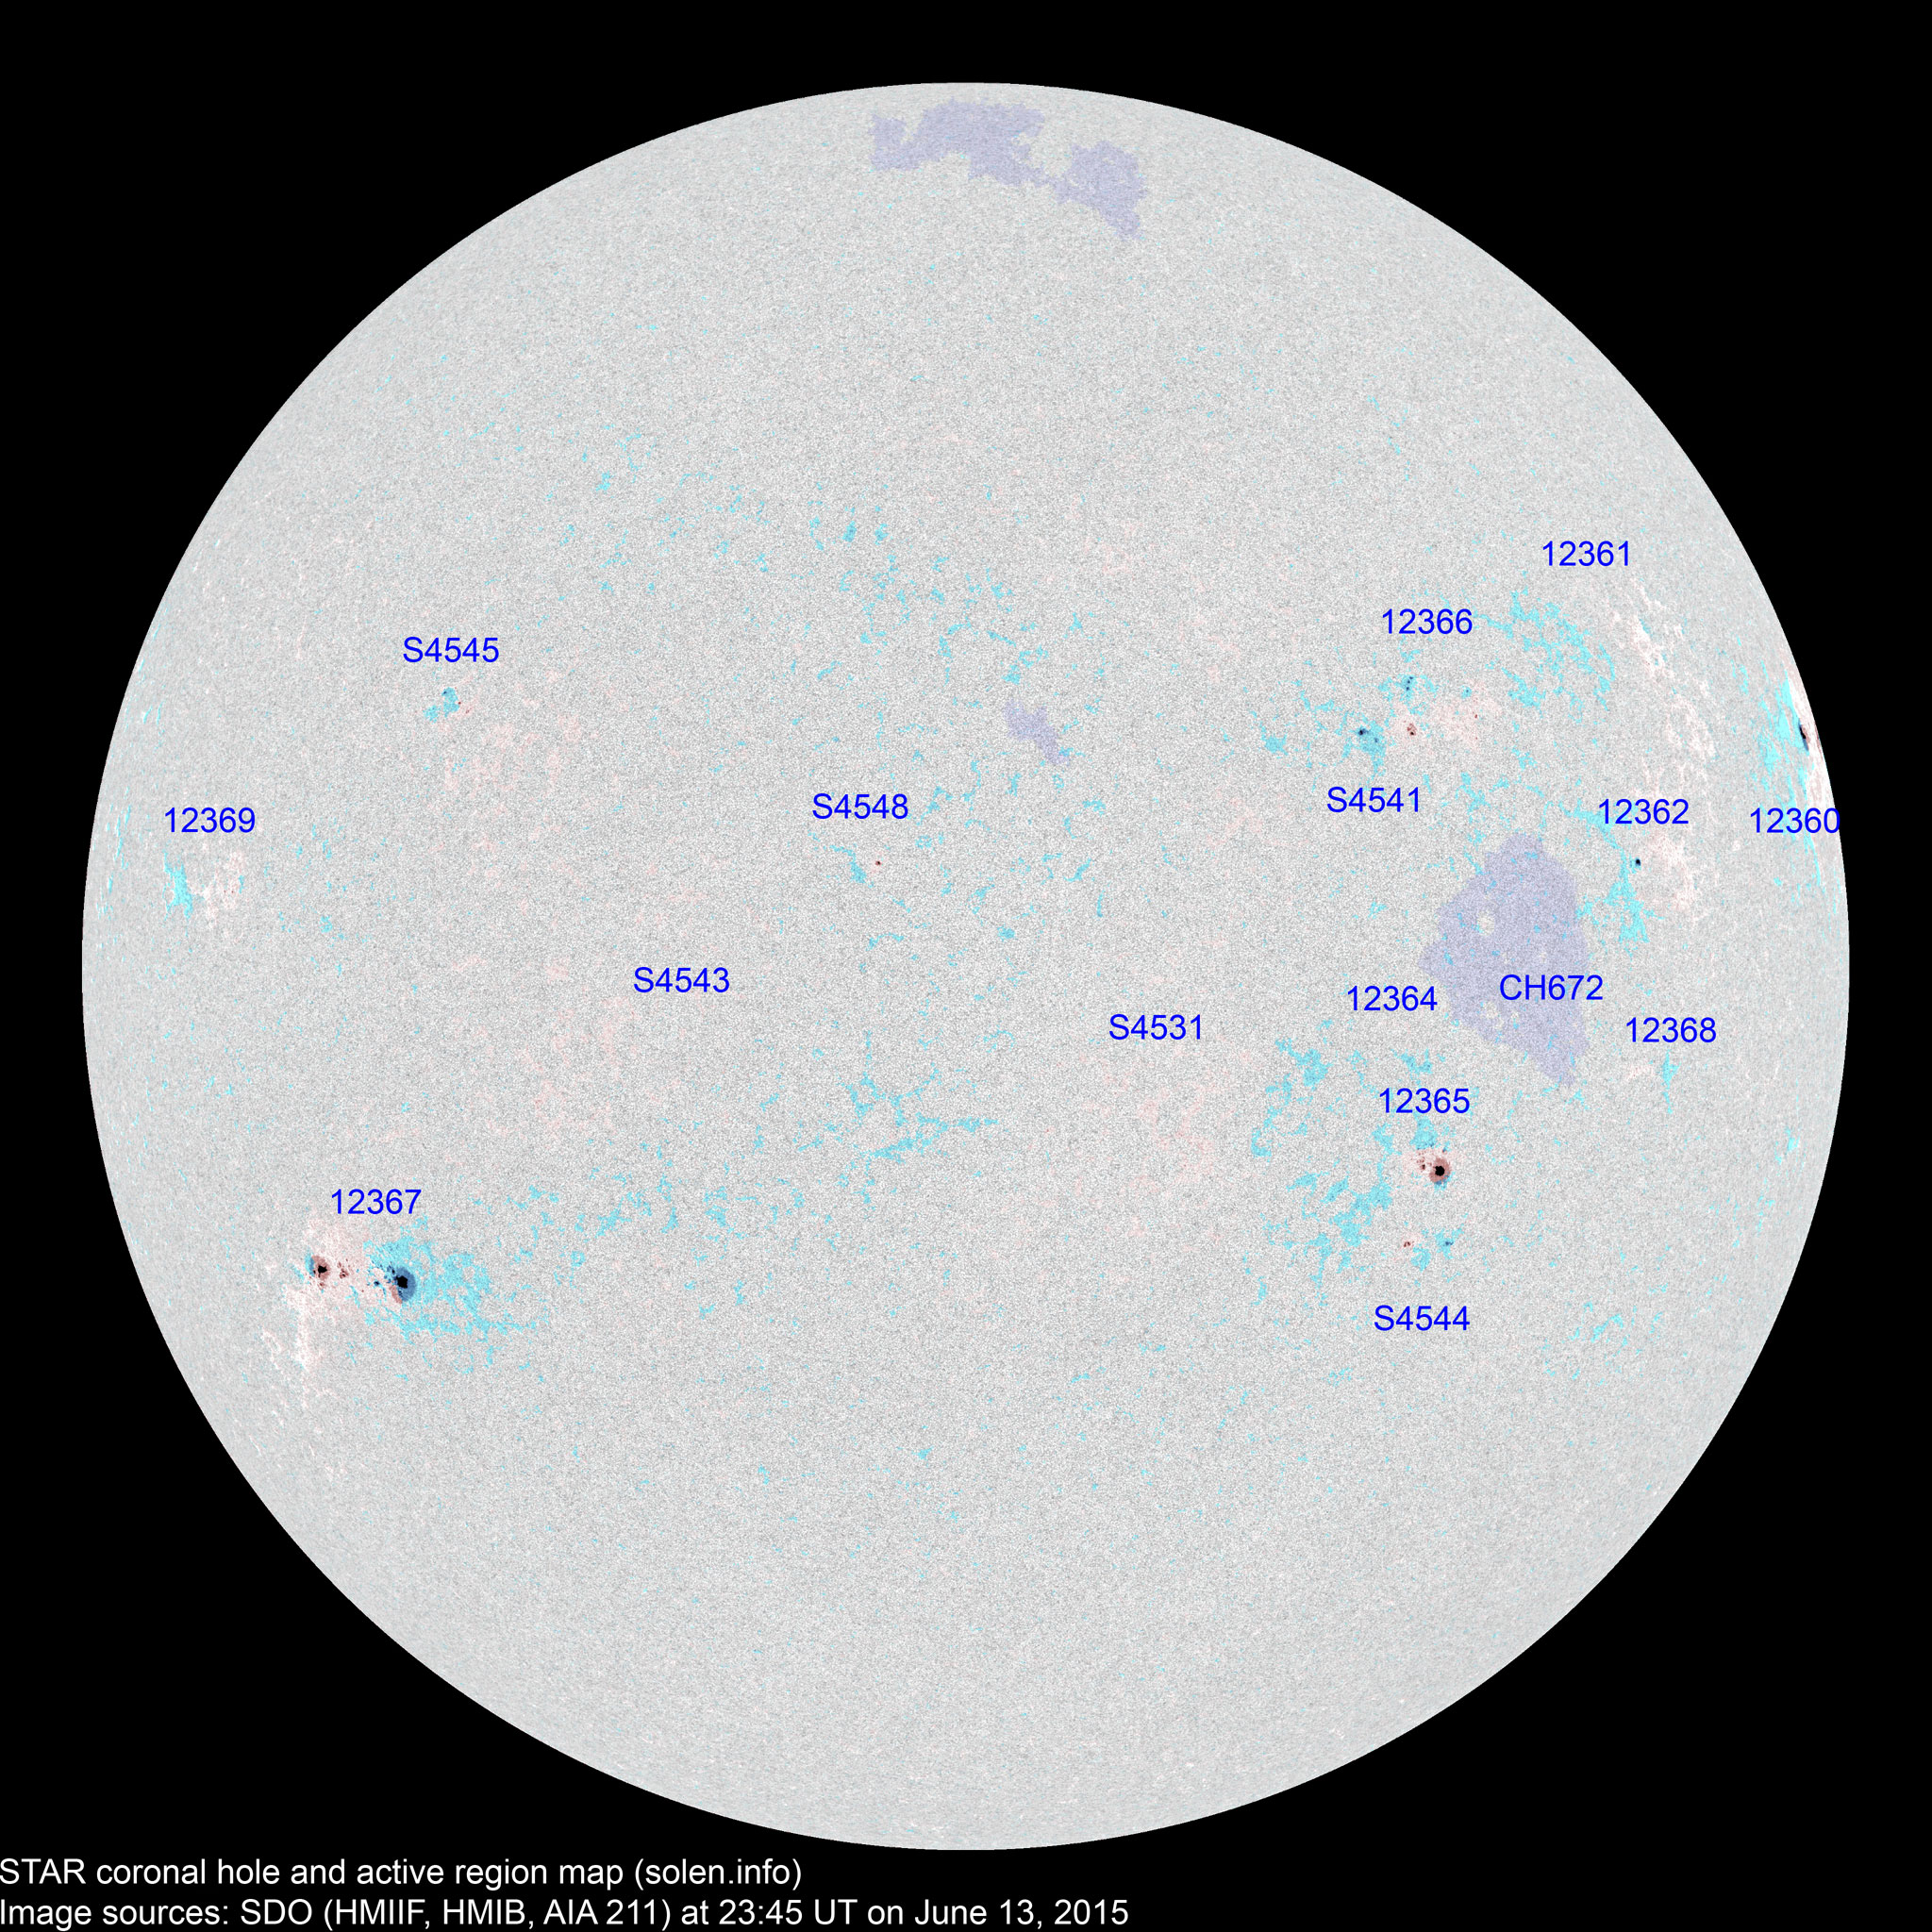
At the time of counting spots (see image time), spots were observed in 15 active regions using 2K resolution (SN: 232) and 10 active regions using 1K resolution (SN: 141) SDO images on the visible solar disk.
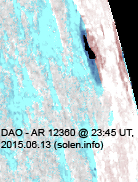
Region 12360 [N15W83] rotated partly out of view
and was very active during the day producing many C flares and an M class event.
A major flare is possible while the region is at and just behind the northwest
limb.
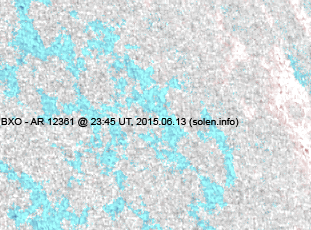
Region 12361 [N21W48] decayed slowly and quietly.
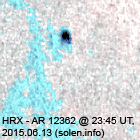
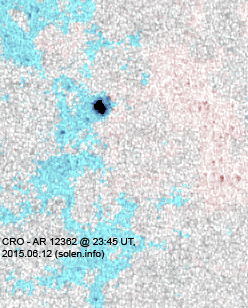
Region 12362 [N07W50] decayed slowly and quietly.
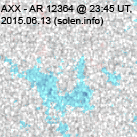
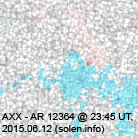
Region 12364 [S05W31] was quiet and stable.
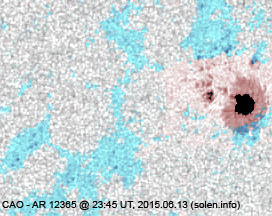
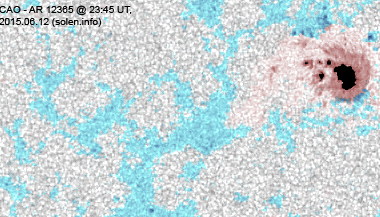
Region 12365 [S12W32] was quiet and stable. The
region has weak polarity intermixing.
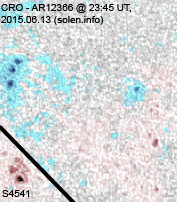
Region 12366 [N18W35] decayed slowly and quietly.
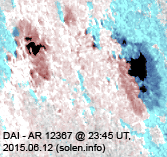
Region 12367 [S20E45] gained penumbral area and was quiet. A minor M
class flare is possible.
New region 12368 [S07W49] emerged on June 9 and was numbered by
SWPC 4 days later as the region decayed.
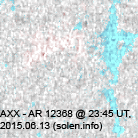
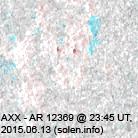
New region 12369 [N05E57] rotated into view on June
12 and was numbered the next day as the region began to decay.
Spotted regions not numbered (or interpreted differently) by SWPC:
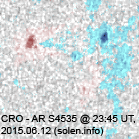
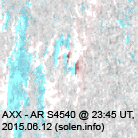
S4531 [S10W13] reemerged with penumbra spots.
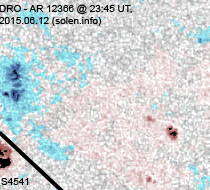
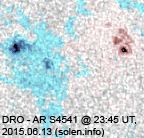
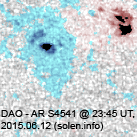
S4541 [N16W30] decayed slowly and quietly.
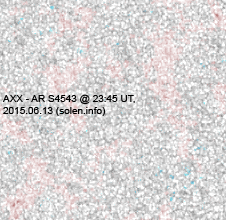
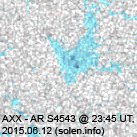
S4543 [S05E26] lost the leader spot and gained trailing penumbra
spots.
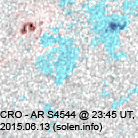
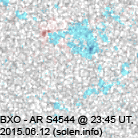
S4544 [S17W33] developed slowly and quietly.
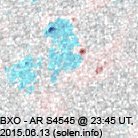
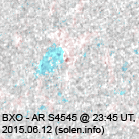
S4545 [N18E38] developed slowly and quietly.
New region S4548 [N08E06] emerged with a few spots.
C2+ flares:
| Magnitude | Peak time (UTC) | Location | AR | Recorded by | Comment |
| C5.9 | 00:33 | N14W74 | 12360 | GOES15 | |
| C3.5 | 01:42 | 12360 | GOES15 | ||
| C5.9 | 02:37 | N15W72 | 12360 | GOES15 | |
| C3.8 | 05:38 | 12360 | GOES15 | ||
| C4.3 | 06:25 | N14W73 | 12360 | GOES15 | |
| C4.0 | 07:00 | 12360 | SDO/EVE | ||
| M1.3 | 07:29 | N11W78 | 12360 | GOES15 | |
| C5.8 | 09:45 | N11W77 | 12360 | GOES15 | |
| C2.4 | 10:29 | 12360 | GOES15 | ||
| C2.2 | 12:50 | N10W78 | 12360 | GOES15 | |
| C4.9 | 14:37 | N11W80 | 12360 | GOES15 | |
| C2.6 | 19:27 | N14W84 | 12360 | GOES15 | |
| C2.5 | 21:25 | N14W84 | 12360 | GOES15 | |
| C2.2 | 23:14 | 12360 | GOES15 |
June 11-13: No obviously Earth directed CMEs were observed.
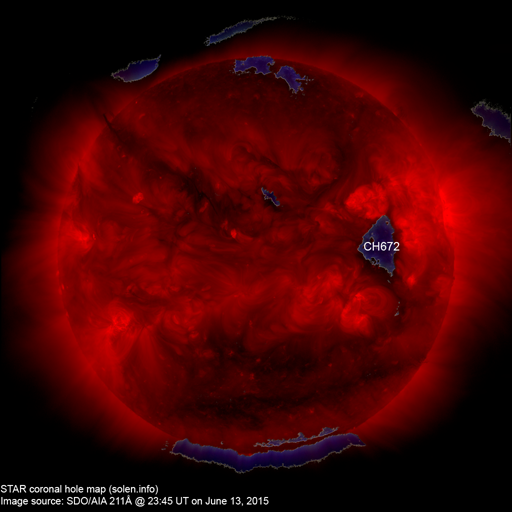
[Coronal hole
history (since October 2002)]
[Compare today's report to the situation one solar rotation ago:
28 days ago
27 days ago
26 days ago]
A recurrent trans equatorial coronal hole (CH672) rotated across the central meridian on June 10-11.
Long distance low and medium frequency (below 2 MHz) propagation along paths north of due west over upper middle latitudes is poor. Propagation on long distance northeast-southwest paths is fair.
The geomagnetic field is expected to be quiet to active on June 14 with a chance of minor storm intervals due to effects from CH672 and quiet to unsettled on June 15-16.
| Coronal holes (1) | Coronal mass ejection (2) | M and X class flares (3) |
1) Effects from a coronal hole could reach Earth within the
next 5 days. When the high speed stream has arrived the color changes to green.
2) Effects from a CME are likely to be observed at Earth within 96 hours.
3) There is a possibility of either M or X class flares within the next 48
hours.
Green: 0-30% probability, Yellow: 30-70% probability, Red: 70-100% probability.
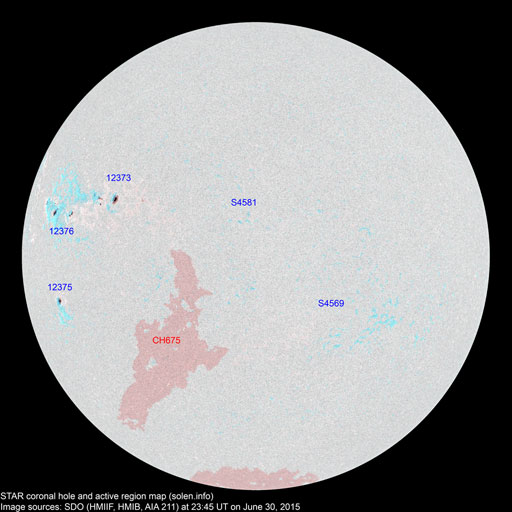
(Click on image for 2K resolution)
Compare to the previous day's image.
When available the active region map has a coronal hole polarity overlay where red (pink) is negative and blue is positive.
Data for all numbered solar regions according to the Solar Region Summary provided by NOAA/SWPC. Comments are my own, as is the STAR spot count (spots observed at or inside a few hours before midnight) and data for regions not numbered by SWPC or where SWPC has observed no spots. SWPC active region numbers in the table below and in the active region map above are the historic SWPC/USAF numbers.
| Active region | Date numbered detected |
Spot count | Location at midnight | Area | Classification | SDO / HMI 4K continuum image with magnetic polarity overlays |
Comment | ||||
|---|---|---|---|---|---|---|---|---|---|---|---|
| SWPC | Magnetic (SDO) |
SWPC | STAR | Current | Previous | ||||||
| 2K | 1K | ||||||||||
| 12360 | 2015.06.01 2015.06.03 |
6 | 3 | 2 | N15W82 | 0150 | EAI | DAO |
 |
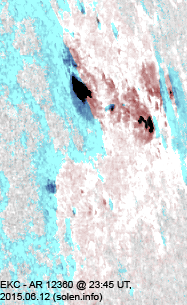 |
area: 0270 |
| 12361 | 2015.06.03 2015.06.04 |
3 | N18W60 | 0006 | BXO |
 |
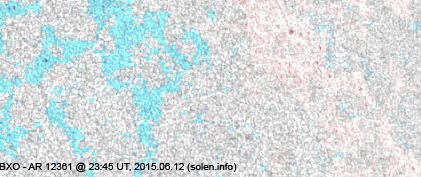 |
location: N21W48 | |||
| 12362 | 2015.06.03 2015.06.04 |
1 | 1 | 1 | N08W51 | 0010 | HRX | HRX |
 |
 |
|
| 12365 | 2015.06.05 2015.06.06 |
7 | 16 | 8 | S15W33 | 0090 | CAO | CAO |
 |
 |
beta-gamma SWPC is incorrectly including AR S4544 in this region location: S12W32 |
| 12364 | 2015.06.05 2015.06.06 |
2 | S07W34 | 0005 | AXX |
 |
 |
|
|||
| 12366 | 2015.06.06 2015.06.07 |
10 | 6 | 5 | N17W33 | 0060 | CAI | CRO |
 |
 |
SWPC is including the spots of AR S4541 |
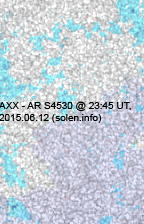
| S4530 | 2015.06.07 | N10W37 |
 |
||||||||
| S4531 | 2015.06.08 | 3 | S10W13 | 0007 | AXX |
 |
|||||
| S4532 | 2015.06.09 | N07W37 | |||||||||
| S4533 | 2015.06.09 | S32W02 | |||||||||
| S4534 | 2015.06.09 | S22W53 | |||||||||
| 12368 | 2015.06.09 2015.06.13 |
1 | S06W52 | 0001 | AXX |
 |
 |
||||
| 12367 | 2015.06.10 2015.06.11 |
12 | 23 | 12 | S20E44 | 0300 | EKI | DKI |
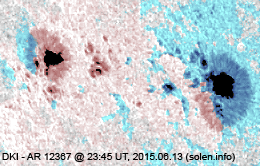 |
 |
area: 0520 |
| S4538 | 2015.06.11 | N18W21 | |||||||||
| S4539 | 2015.06.11 | S10E40 | |||||||||
| 12369 | 2015.06.12 2015.06.13 |
1 | 2 | 1 | N06E55 | 0000 | AXX |
 |
 |
area: 0006 | |
| S4541 | 2015.06.12 | 6 | 5 | N16W30 | 0040 | DRO |
 |
 |
split off from AR 12366 | ||
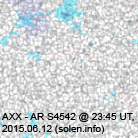
| S4542 | 2015.06.12 | N11W08 |
 |
||||||||
| S4543 | 2015.06.12 | 2 | S05E26 | 0005 | AXX |
 |
 |
||||
| S4544 | 2015.06.12 | 6 | 3 | S17W33 | 0020 | CRO |
 |
 |
|||
| S4545 | 2015.06.12 | 6 | 3 | N18E38 | 0015 | BXO |
 |
 |
|||
| S4546 | 2015.06.12 | S33W52 |
 |
||||||||
| S4548 | 2015.06.13 | 2 | 1 | N08E06 | 0009 | CRO |
 |
||||
| Total spot count: | 37 | 82 | 41 | ||||||||
| Sunspot number: | 97 | 232 | 141 | (total spot count + 10 * number of spotted regions) | |||||||
| Weighted SN: | 65 | 117 | 76 | (Sum of total spot count + classification weighting for each AR. Classification weighting: X=0, R=3, A/S=5, H/K=10) | |||||||
| Relative sunspot number (Wolf number): | 58 | 81 | 78 | k * (sunspot number). k = 0.6 for SWPC, k = 0.35 for MSN 2K, k = 0.55 for MSN 1K (MSN=Magnetic Sunspot Number) | |||||||
| Month | Average solar flux | International sunspot number (WDC-SILSO) |
Smoothed sunspot number | Average
ap (3) |
|
|---|---|---|---|---|---|
| Measured | 1 AU | ||||
| 2014.01 | 157.4 | 152.4 | 81.8 | 77.3 (+1.3) | 5.44 |
| 2014.02 | 170.3 (cycle peak) |
166.3 | 102.3 (cycle peak) | 78.4 (+1.1) | 10.70 |
| 2014.03 | 149.9 | 148.5 | 91.9 | 80.8 (+2.4) | 4.88 |
| 2014.04 | 143.9 | 144.8 | 84.7 | 81.9 (+1.1) (solar max) | 7.88 |
| 2014.05 | 129.7 | 132.9 | 75.2 | 80.5 (-1.4) | 5.75 |
| 2014.06 | 122.0 | 125.8 | 71.0 | 79.7 (-0.8) | 6.72 |
| 2014.07 | 137.4 | 141.8 | 72.5 | 78.5 (-1.2) | 4.50 |
| 2014.08 | 124.7 | 127.9 | 74.7 | 75.5 (-3.0) | 7.71 |
| 2014.09 | 146.6 | 148.1 | 87.6 | 70.8 (-4.7) | 9.78 |
| 2014.10 | 153.4 | 152.9 | 60.6 | 67.3 (-3.5) | 8.96 |
| 2014.11 | 154.8 | 151.4 | 70.1 | 65.4 (-1.9) | 9.33 |
| 2014.12 | 158.7 | 153.8 | 78.0 | (63.5 projected, -1.9) | 11.24 |
| 2015.01 | 141.9 | 137.3 | 67.0 | (61.3 projected, -2.2) | 9.46 |
| 2015.02 | 129.1 | 126.0 | 44.8 | (59.6 projected, -1.7) | 9.92 |
| 2015.03 | 125.9 | 124.6 | 38.4 | (57.2 projected, -2.4) | 16.14 |
| 2015.04 | 128.8 | 129.7 | 54.4 | (54.6 projected, -2.6) | 10.73 |
| 2015.05 | 120.0 | 122.6 | 58.8 | (52.4 projected, -2.2) | 8.29 |
| 2015.06 | (126.0) | 40.3 (2A)/ 93.0 (2B) / 65.1 (2C) | (49.6 projected, -2.8) | (7.9) | |
1) Running average based on the daily 20:00 UTC observed solar flux value at
2800 MHz.
2A) Current impact on the monthly sunspot number based on the Boulder
(NOAA/SWPC) sunspot number (accumulated daily sunspots / month days). The
official WDC-SILSO international sunspot number is typically 30-50% lower. 2B)
Boulder SN current month average to date. 2C) STAR SDO 1K Wolf number 30 day
average.
3) Running average based on the quicklook and definitive Potsdam WDC ap
indices. Values in red are based on the definitive
international
GFZ Potsdam
WDC
ap indices.
This report has been prepared by Jan Alvestad. It is based on the analysis of data from whatever sources are available at the time the report is prepared. All time references are to the UTC day. Comments and suggestions are always welcome.
SDO images are courtesy of NASA/SDO and the AIA, EVE, and HMI science teams.