
The geomagnetic field was very quiet on September 28. Solar wind speed at SOHO ranged between 347 and 420 km/s.
Solar flux at 20h UTC on 2.8 GHz was 124.0 (increasing 35.0 over the last solar rotation). The 90 day 10.7 flux at 1 AU was 106.6. The Potsdam WDC planetary A index was 3 (STAR Ap - based on the mean of three hour interval ap indices: 3.3). Three hour interval K indices: 11001111 (planetary), 11002311 (Boulder).
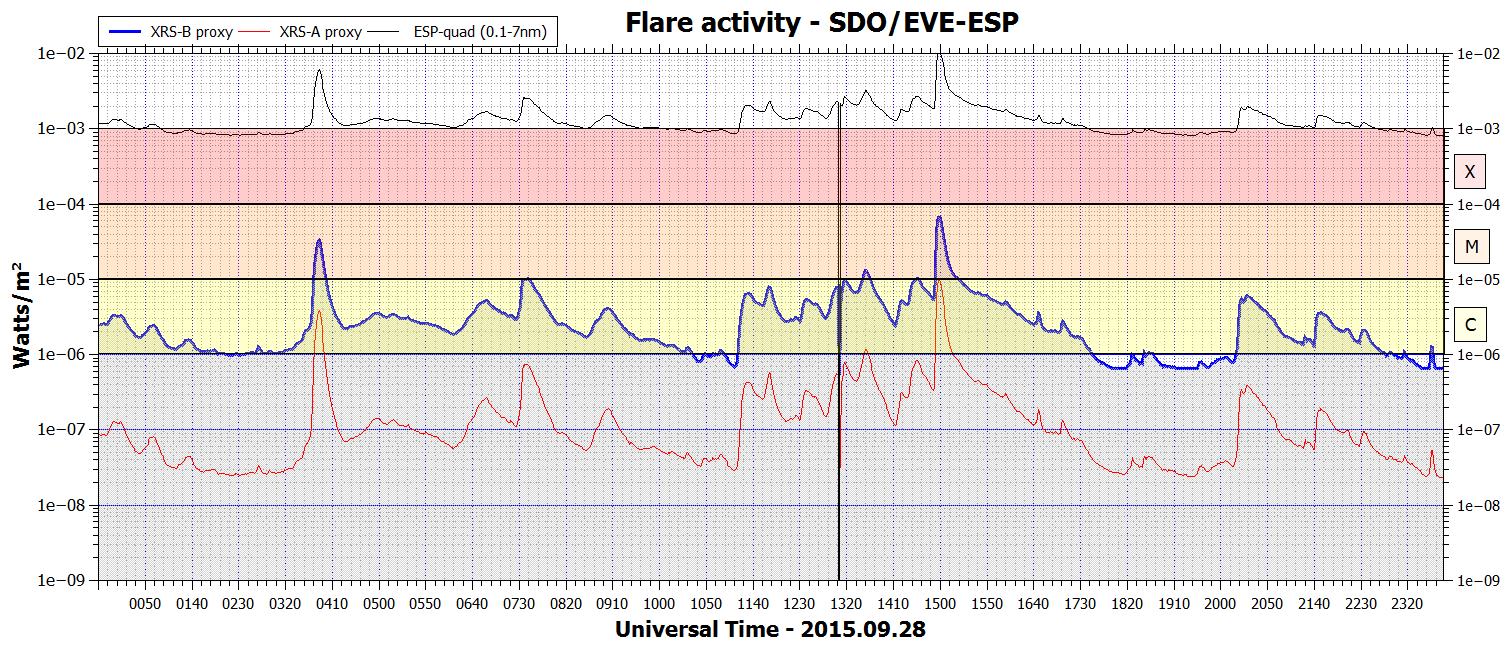
The background x-ray flux is at the class B8 level.
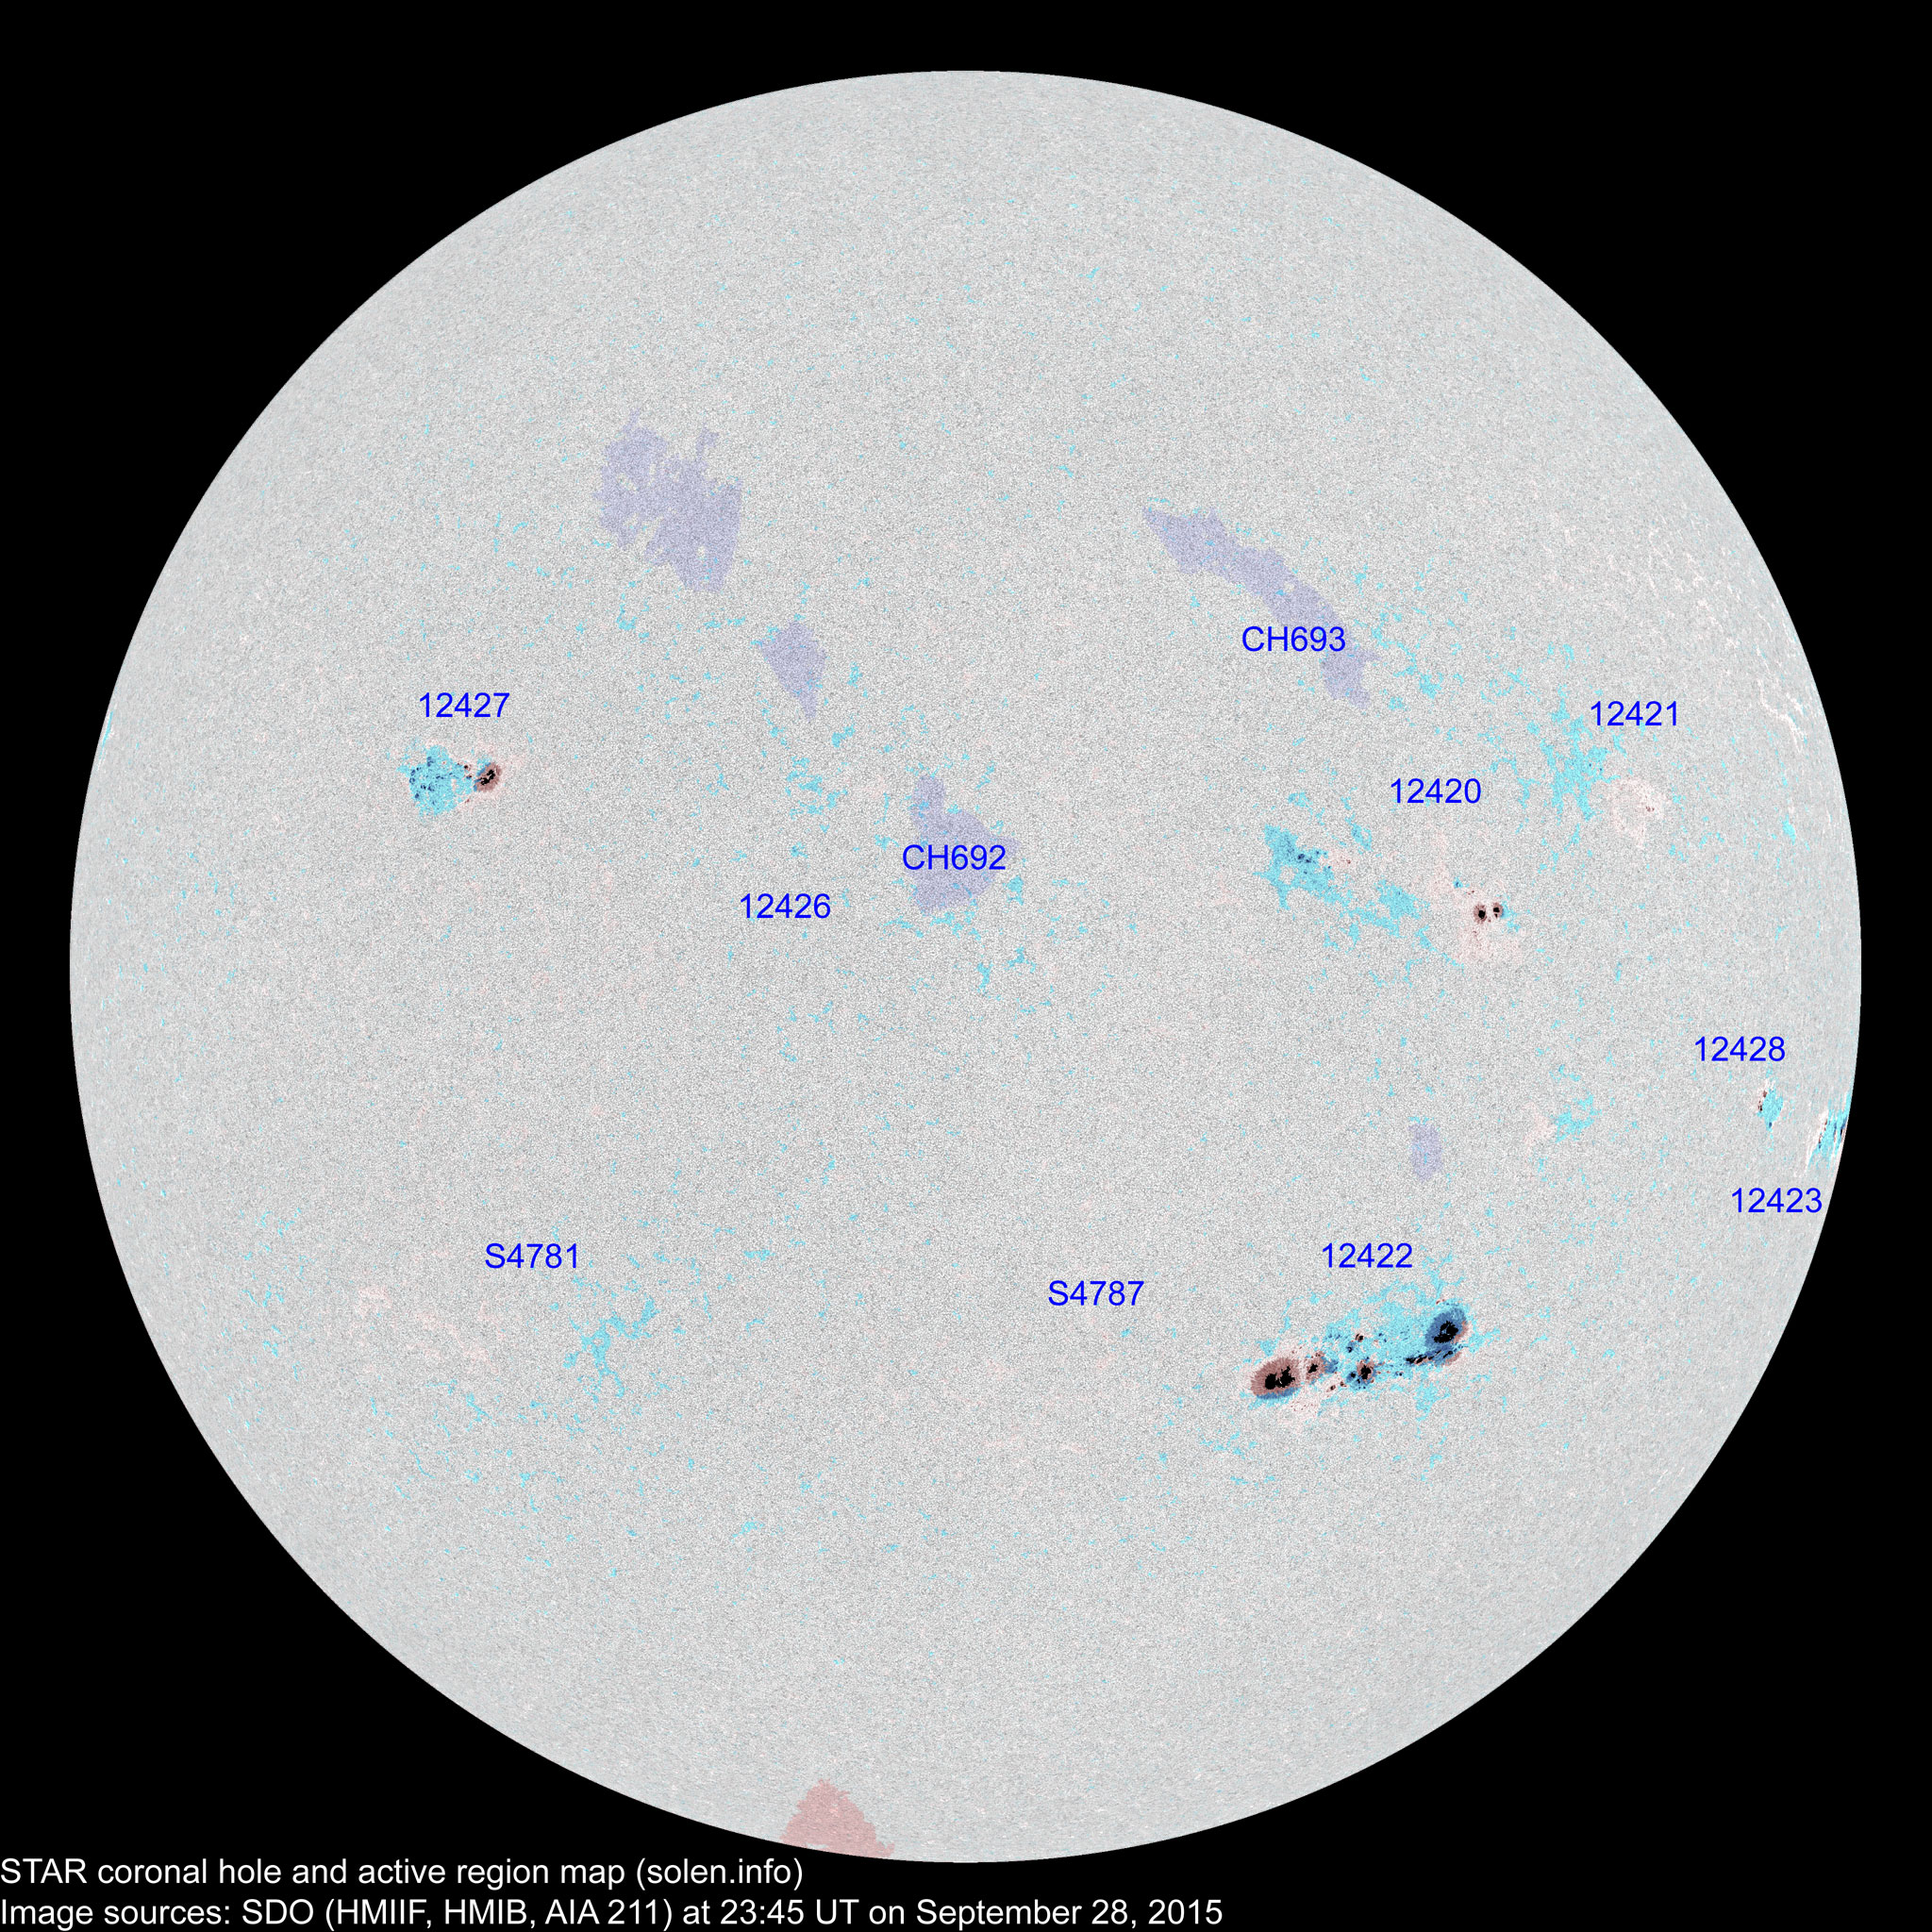
At the time of counting spots (see image time), spots were observed in 9 active regions using 2K resolution (SN: 246) and 6 active regions using 1K resolution (SN: 136) SDO images on the visible solar disk.
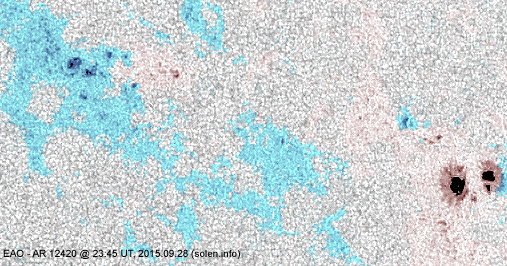
Region 12420 [N10W33] decayed slowly and quietly.
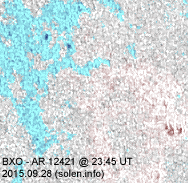
Region 12421 [N15W50] decayed further and was quiet.
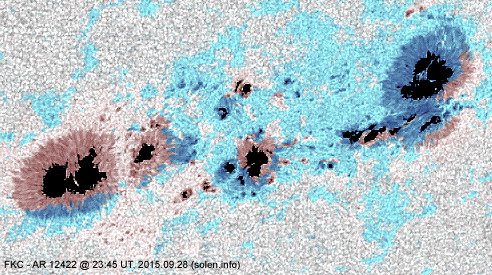
Region 12422 [S20W28] gained spots and was very active producing many C
and M flares. The region has 2 significant magnetic deltas. Another major flare
is possible.
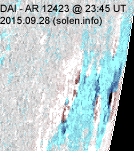
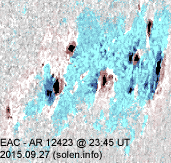
Region 12423 [S09W79] rotated partly out of view and appears to have
simplified somewhat over the last day.
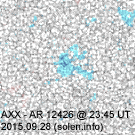
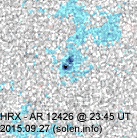
Region 12426 [N13E11] decayed slowly and quietly.
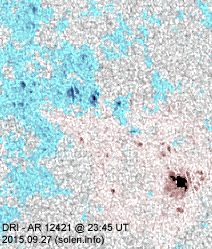
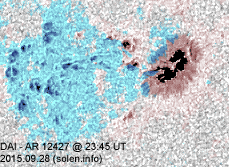
Region 12427 [N18E35] developed further and has
many small spots in the intermediate and trailing spot sections. C flares are
possible.
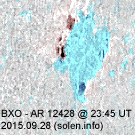
New region 12428 [S06W63] emerged on September 27 and was numbered by
SWPC the next day.
Spotted regions not numbered (or interpreted differently) by SWPC:
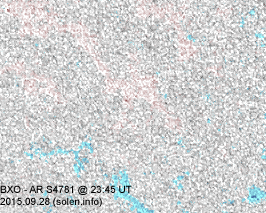
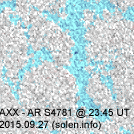
S4781 [S21E35] was quiet and stable.
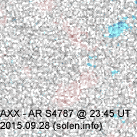
New region S4787 [S18W09] emerged with a penumbra spot early in the day
and was decaying slowly late in the day.
C2+ flares:
| Magnitude | Peak time (UTC) | Location | AR | Recorded by | Comment |
| C3.2 | 00:13 | S21W17 | 12422 | SDO/EVE | recorded by Learmonth as well |
| C2.4 | 00:58 | S09W65 | 12423 | SDO/EVE | |
| M3.6 | 03:45 | S09W67 | 12423 | GOES15 | |
| C2.0 | 05:31 | 12423 | GOES13 | ||
| C4.5 | 06:54 | S21W17 | 12422 | GOES15 | incorrectly assigned to AR 12423 by SWPC. Recorded by San Vito as well with correct location |
| M1.1/1N | 07:35 | S22W20 | 12422 | GOES15 | |
| C3.7 | 09:04 | 12423 | GOES15 | ||
| C8.5/1F | 11:32 | S22W24 | 12422 | GOES15 | C7.5 @ SDO/EVE |
| C8.1 | 11:57 | S09W72 | 12423 | GOES15 | location unreported by SWPC |
| C5.4 | 12:36 | 12422 | GOES15 | ||
| C7.8 | 13:09 | SDO/EVE | |||
| M1.1/1N | 13:16 | S22W24 | 12422 | GOES15 | C9.9 @ SDO/EVE @ 13:18 |
| M1.3 | 13:40 | S10W70 | 12423 | SDO/EVE | recorded by San Vito as well |
| C5.4 | 14:19 | 12423 | SDO/EVE | ||
| C9.8/1N | 14:33 | S22W21 | 12422 | GOES15 | |
| M7.6 | 14:58 | S20W28 | 12422 | GOES15 | |
| C3.4 | 16:45 | 12422 | GOES15 | ||
| C2.8 | 17:11 | 12422 | GOES15 | ||
| C7.6 | 20:21 | 12423 | GOES15 | ||
| C4.3 | 21:44 | S09W81 | 12423 | GOES15 | assigned to AR 12422 by SWPC, stronger activity in AR 12423 |
| C2.4 | 22:32 | 12422 | GOES15 | ||
| C2.0 | 23:45 | 12422 | GOES15 | C1.2 @ SDO/EVE |
September 26-28: No obviously Earth directed CMEs were observed in available LASCO imagery.
[Coronal hole
history (since October 2002)]
[Compare today's report to the situation one solar rotation ago:
28 days ago
27 days ago
26 days ago]
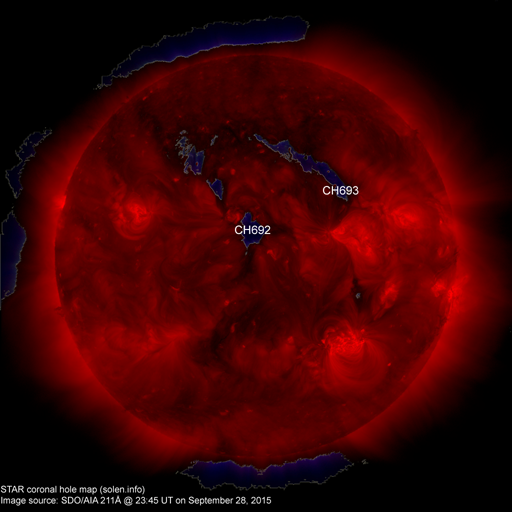
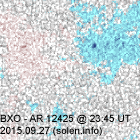
A recurrent northern hemisphere coronal hole (CH692) could rotate into an Earth facing position on September 29. A small coronal hole between ARs 12425 and 12422 was in a potentially geoeffective position on September 26 and could cause a brief disturbance on September 29. A northern hemisphere coronal hole (CH693) was in an Earth facing position on September 26-27, however, it is uncertain if this CH is too far to the north to cause a geomagnetic disturbance.
Long distance low and medium frequency (below 2 MHz) propagation along paths north of due west over upper middle latitudes is fair. Propagation on long distance northeast-southwest paths is poor.
The geomagnetic field is expected to be quiet on September 29. Quiet is likely on September 30 and on October 1 as well, however, there is some uncertainty as CH693 could cause unsettled and active intervals if it isn't too far to the north.
| Coronal holes (1) | Coronal mass ejection (2) | M and X class flares (3) |
1) Effects from a coronal hole could reach Earth within the
next 5 days. When the high speed stream has arrived the color changes to green.
2) Effects from a CME are likely to be observed at Earth within 96 hours.
3) There is a possibility of either M or X class flares within the next 48
hours.
Green: 0-30% probability, Yellow: 30-70% probability, Red: 70-100% probability.
(Click on image for 2K resolution)
Compare to the previous day's image.
When available the active region map has a coronal hole polarity overlay where red (pink) is negative and blue is positive.
Data for all numbered solar regions according to the Solar Region Summary provided by NOAA/SWPC. Comments are my own, as is the STAR spot count (spots observed at or inside a few hours before midnight) and data for regions not numbered by SWPC or where SWPC has observed no spots. SWPC active region numbers in the table below and in the active region map above are the historic SWPC/USAF numbers.
| Active region | Date numbered detected |
Spot count | Location at midnight | Area | Classification | SDO / HMI 4K continuum image with magnetic polarity overlays |
Comment | ||||
|---|---|---|---|---|---|---|---|---|---|---|---|
| SWPC | Magnetic (SDO) |
SWPC | STAR | Current | Previous | ||||||
| 2K | 1K | ||||||||||
| 12420 | 2015.09.19 2015.09.20 |
9 | 29 | 13 | N11W31 | 0100 | ESO | EAO |
 |
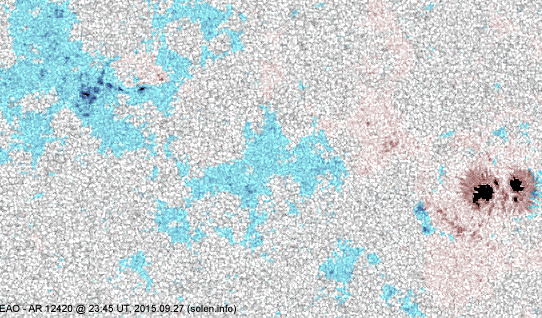 |
beta-gamma location: N10W33 |
| 12421 | 2015.09.20 2015.09.22 |
4 | 9 | 4 | N15W50 | 0010 | BXO | BXO |
 |
 |
|
| 12423 | 2015.09.21 2015.09.23 |
9 | 9 | 5 | S09W80 | 0180 | DAC | DAI |
 |
 |
beta-gamma |
| 12422 | 2015.09.22 | 25 | 66 | 33 | S20W30 | 0690 | FKC | FKC |
 |
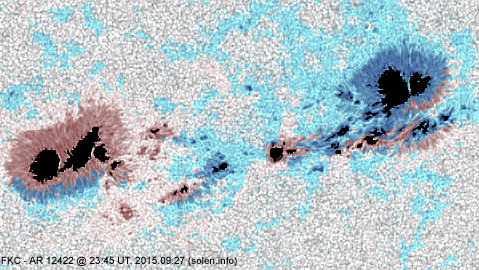 |
beta-gamma-delta area: 1020 location: S20W28 |
| 12425 | 2015.09.23 2015.09.25 |
S05W42 |
 |
||||||||
| 12426 | 2015.09.24 2015.09.25 |
2 | N16E08 | 0003 | AXX |
 |
 |
||||
| S4780 | 2015.09.24 | N30W03 | |||||||||
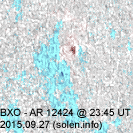
| 12424 | 2015.09.25 | N12W72 |
 |
||||||||
| S4781 | 2015.09.26 | 3 | S21E35 | 0004 | BXO |
 |
 |
||||
| S4782 | 2015.09.26 | N25W34 | |||||||||
| 12427 | 2015.09.27 | 9 | 30 | 18 | N18E35 | 0060 | CSI | DAI |
 |
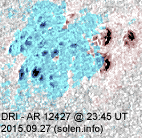 |
beta-gamma area: 0290 |
| 12428 | 2015.09.27 2015.09.28 |
4 | 7 | 3 | S05W64 | 0010 | BXO | BXO |
 |
 |
|
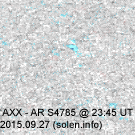
| S4785 | 2015.09.27 | N65W18 |
 |
||||||||
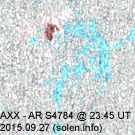
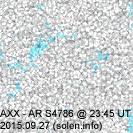
| S4786 | 2015.09.27 | S10W32 |
 |
||||||||
| S4787 | 2015.09.28 | 1 | S18W09 | 0002 | AXX |
 |
|||||
| Total spot count: | 60 | 156 | 76 | ||||||||
| Sunspot number: | 120 | 246 | 136 | (total spot count + 10 * number of spotted regions) | |||||||
| Weighted SN: | 85 | 181 | 101 | (Sum of total spot count + classification weighting for each AR. Classification weighting: X=0, R=3, A/S=5, H/K=10) | |||||||
| Relative sunspot number (Wolf number): | 132 | 135 | 116 | k * (sunspot number) As of July 1, 2015: k = 1.1 for SWPC, k = 0.55 for MSN 2K, k = 0.85 for MSN 1K (MSN=Magnetic Sunspot Number) |
|||||||
| Month | Average solar flux | International sunspot number (WDC-SILSO) (4) |
Smoothed sunspot number (4) | Average
ap (3) |
|
|---|---|---|---|---|---|
| Measured | 1 AU | ||||
| 2014.02 | 170.3 (cycle peak) |
166.3 | 146.1 (cycle peak) | 110.5 (+1.2) | 10.70 |
| 2014.04 | 143.9 | 144.8 | 112.5 | 116.4 (+2.1) (solar max) | 7.88 |
| 2014.05 | 129.7 | 132.9 | 112.5 | 115.0 (-1.4) | 5.75 |
| 2014.06 | 122.0 | 125.8 | 102.9 | 114.1 (-0.9) | 6.72 |
| 2014.07 | 137.4 | 141.8 | 100.2 | 112.6 (-1.5) | 4.50 |
| 2014.08 | 124.7 | 127.9 | 106.9 | 108.3 (-4.3) | 7.71 |
| 2014.09 | 146.6 | 148.1 | 130.0 | 101.9 (-6.4) | 9.78 |
| 2014.10 | 153.4 | 152.9 | 90.0 | 97.4 (-4.5) | 8.96 |
| 2014.11 | 154.8 | 151.4 | 103.6 | 95.0 (-2.4) | 9.33 |
| 2014.12 | 158.7 | 153.8 | 112.9 | 92.6 (-2.4) | 11.24 |
| 2015.01 | 141.9 | 137.3 | 93.0 | 89.8 (-2.8) | 9.46 |
| 2015.02 | 129.1 | 126.0 | 66.7 | 86.6 (-3.2) | 9.92 |
| 2015.03 | 125.9 | 124.6 | 54.5 | (82.1 projected, -4.5) | 16.14 |
| 2015.04 | 128.8 | 129.7 | 78.0 | (78.0 projected, -4.1) | 10.73 |
| 2015.05 | 120.0 | 122.6 | 90.0 | (75.3 projected, -2.7) | 8.29 |
| 2015.06 | 122.3 | 126.1 | 68.3 | (71.6 projected, -3.7) | 13.15 |
| 2015.07 | 107.0 | 110.8 | 66.4 | (67.9 projected, -3.7) | 8.83 |
| 2015.08 | 105.4 | 108.0 | 64.6 | (66.7 projected, -1.2) | 14.58 |
| 2015.09 | (99.7) | 65.9 (2A) / 70.6 (2B) / 82.5 (2C) | (67.0 projected, +0.3) | (16.6) | |
1) Running average based on the daily 20:00 UTC observed solar flux value at
2800 MHz.
2A) Current impact on the monthly sunspot number based on the Boulder
(NOAA/SWPC) sunspot number (accumulated daily sunspots / month days).
2B)
Boulder SN current month average to date.
2C) STAR SDO 1K Wolf number 30 day
average.
3) Running average based on the quicklook and definitive Potsdam WDC ap
indices. Values in red are based on the definitive
international
GFZ Potsdam
WDC
ap indices.
4) Updated to new data set from WDC-SILSO on July 1, 2015
This report has been prepared by Jan Alvestad. It is based on the analysis of data from whatever sources are available at the time the report is prepared. All time references are to Universal Time. Comments and suggestions are always welcome.
SDO images are courtesy of NASA/SDO and the AIA, EVE, and HMI science teams.