
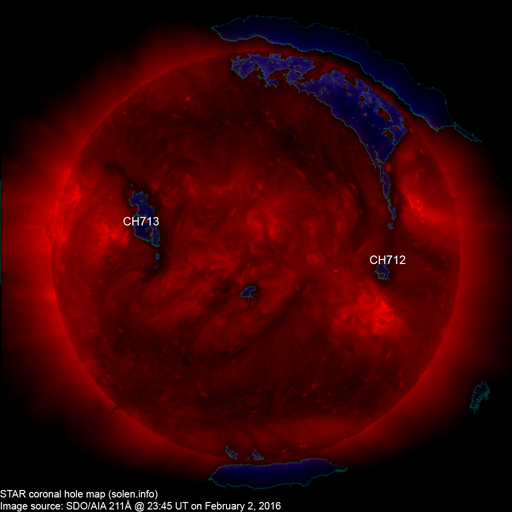
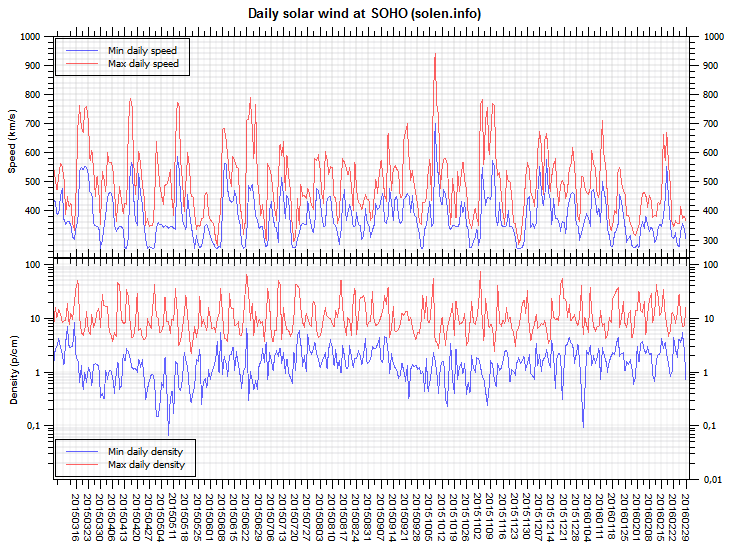
The geomagnetic field was quiet to active on February 3. Solar wind speed at SOHO ranged between 342 and 411 km/s under the influence of effects from CH712.
Solar flux at 20h UTC on 2.8 GHz was 112.1 (increasing 8.7 over the last solar rotation). The 90 day 10.7 flux at 1 AU was 104.7. The Potsdam WDC planetary A index was 11 (STAR Ap - based on the mean of three hour interval ap indices: 10.9). Three hour interval K indices: 44311111 (planetary), 54322212 (Boulder).
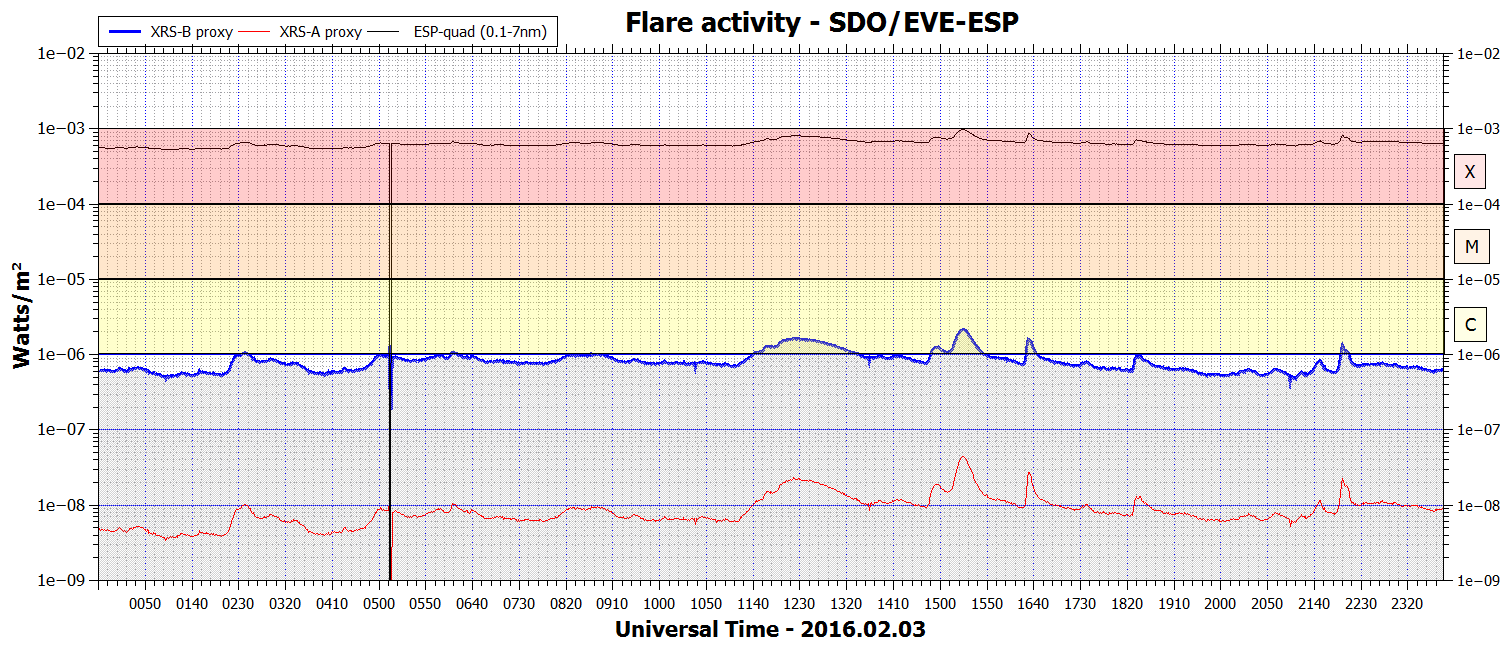
The background x-ray flux is at the class B6 level.
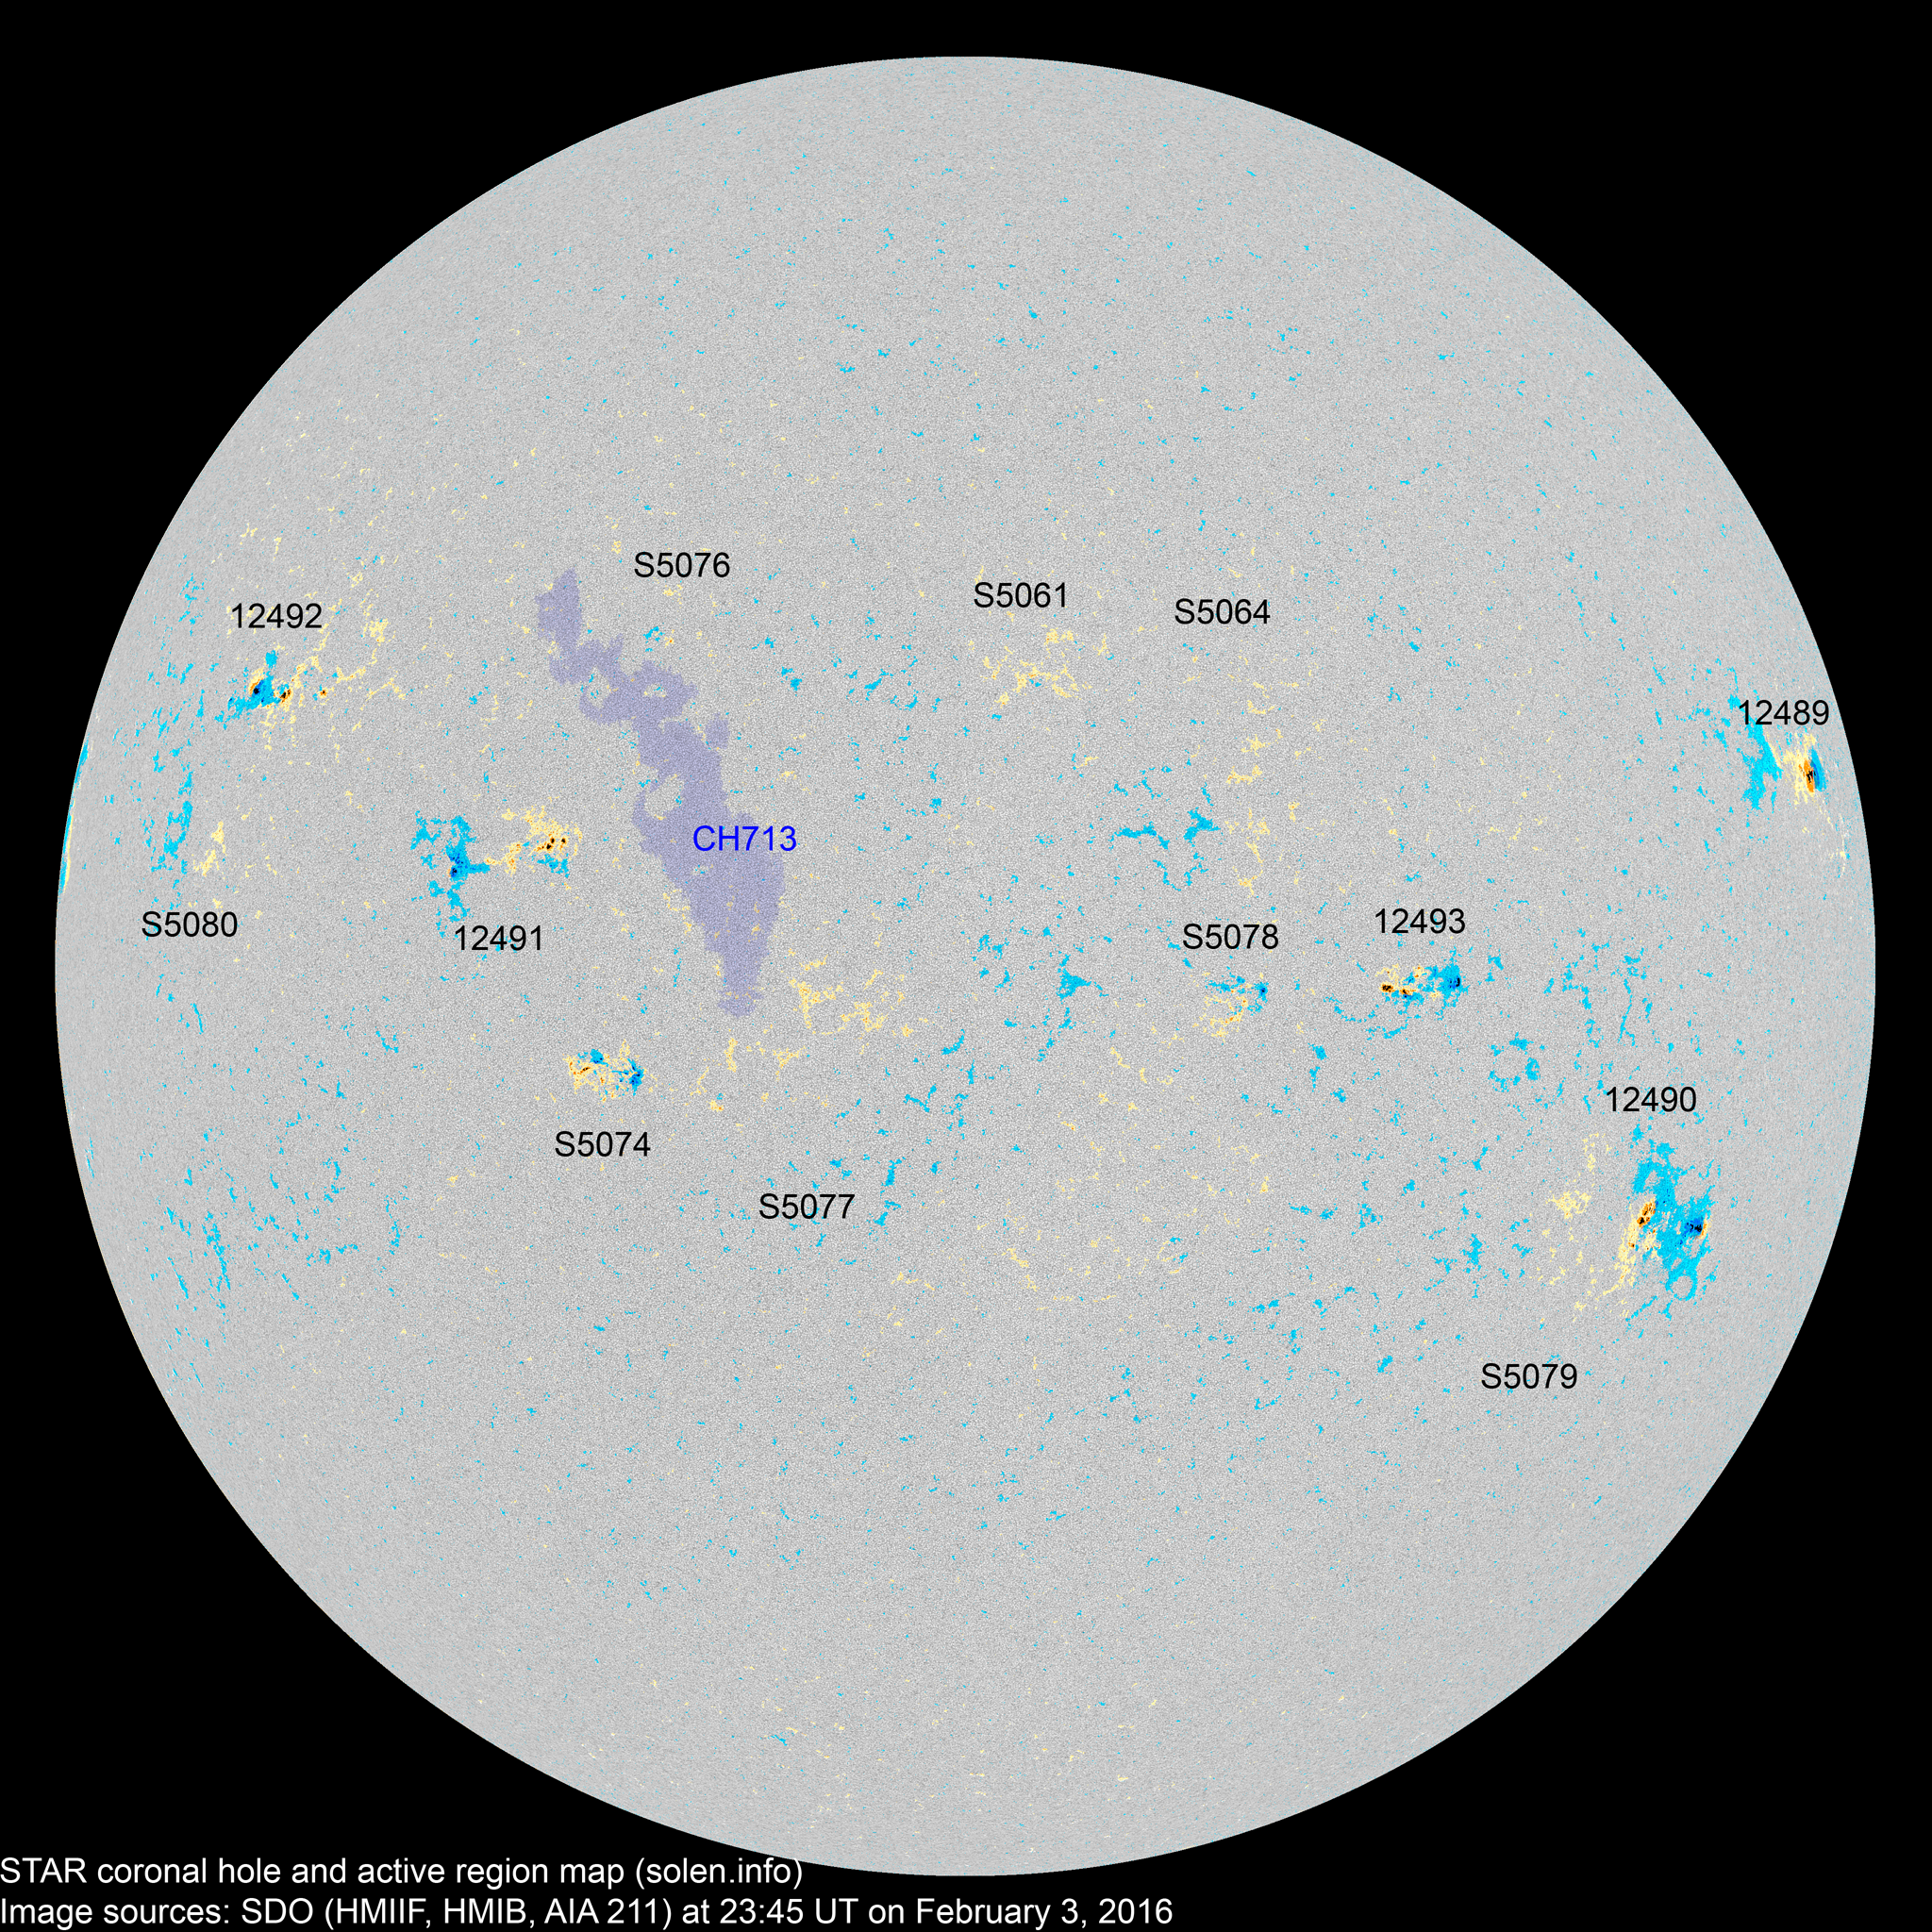
At the time of counting spots (see image time), spots were observed in 13 active regions using 2K resolution (SN: 283) and 9 active regions using 1K resolution (SN: 149) SDO images on the visible solar disk.
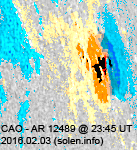
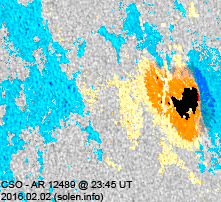
Region 12489 [N10W72] was quiet and stable.
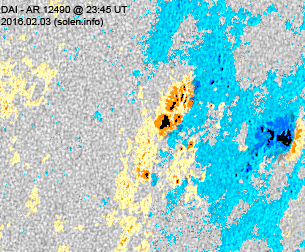
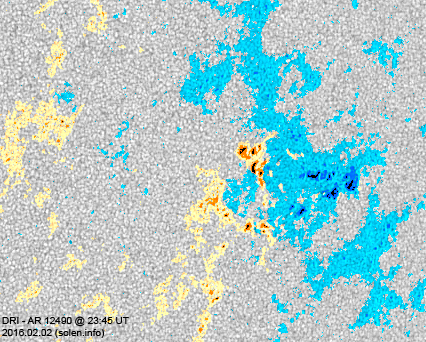
Region 12490 [S19W56] developed further and could produce C flares.
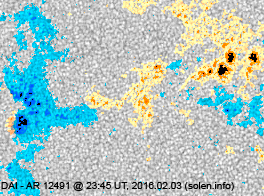
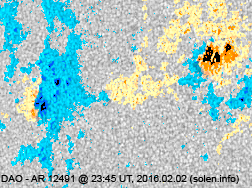
Region 12491 [N02E30] developed slowly and quietly.
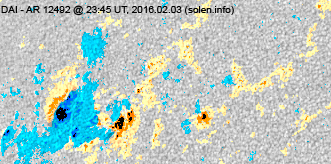
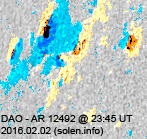
Region 12492 [N14E51] gained a few spots and was mostly quiet.
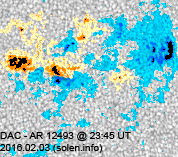
New region 12493 [S07W30] emerged on February 2 with SWPC numbering the
region the next day as it developed further. The region has a weak magnetic
delta and could produce a minor M class flare if the region develops further.
Spotted regions not numbered (or interpreted differently) by SWPC:
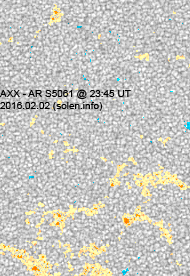
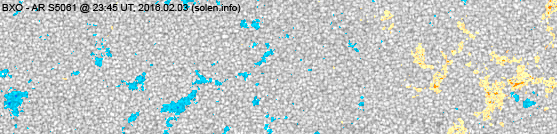
S5061 [N12W02] was quiet and stable.
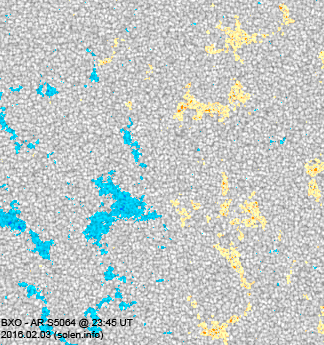
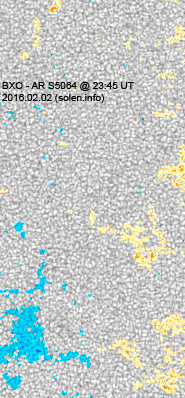
S5064 [N06W16] was quiet and stable.
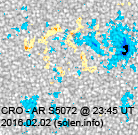
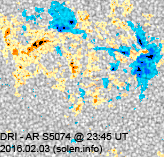
New region S5074 [S12E23] emerged quickly early in the day with many
spots and polarity intermixing. C flares are possible.
New region S5076 [N15E20] emerged with tiny spots.
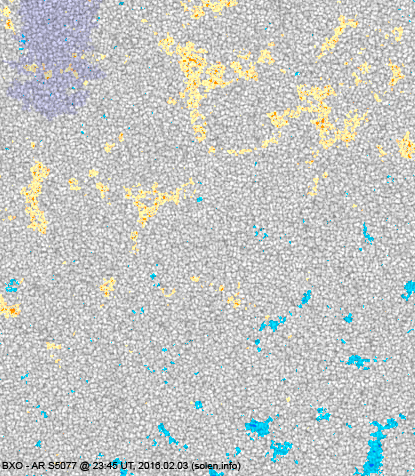
New region S5077 [S14E10] was observed with tiny spots.
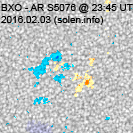
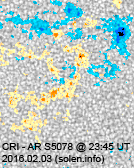
New region S5078 [S08W18] emerged with several
spots.
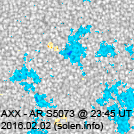
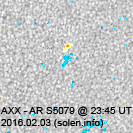
New region S5079 [S26W46] was observed with a tiny spot.
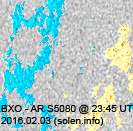
New region S5080 [N06E58] was observed with tiny spots in an old plage
area.
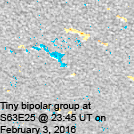
With the new images it's possible to observe tiny spots near the poles. This is a bipolar region observed at S63E25 with two extremely small spots only visible at 4K resolution
C2+ flares:
| Magnitude | Peak time (UT) | Location | AR | Recorded by | Comment |
January 31 - February 2: No obviously Earth directed CMEs were observed in available LASCO imagery.
[Coronal hole
history (since October 2002)]
[Compare today's report to the situation one solar rotation ago:
28 days ago
27 days ago
26 days ago]
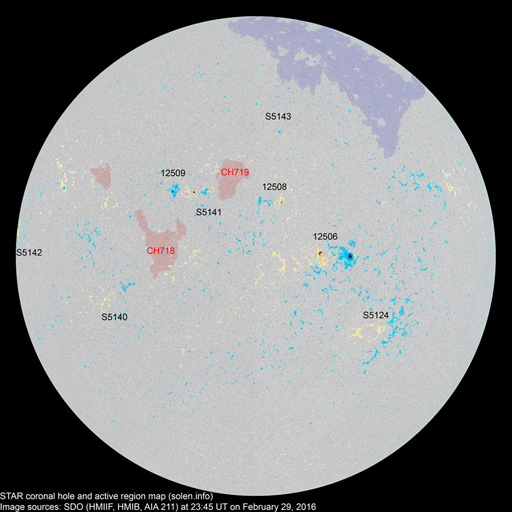
A trans equatorial coronal hole (CH712) rotated across the central meridian on January 30-31. A recurrent trans equatorial coronal hole (CH713) will likely rotate into a potentially geoeffective position on February 5.
Long distance low and medium frequency (below 2 MHz) propagation along paths north of due west over upper middle latitudes is poor. Propagation on long distance northeast-southwest paths is poor.
The geomagnetic field is expected to be quiet on February 4-6.
| Coronal holes (1) | Coronal mass ejection (2) | M and X class flares (3) |
1) Effects from a coronal hole could reach Earth within the
next 5 days. When the high speed stream has arrived the color changes to green.
2) Effects from a CME are likely to be observed at Earth within 96 hours.
3) There is a possibility of either M or X class flares within the next 48
hours.
Green: 0-30% probability, Yellow: 30-70% probability, Red: 70-100% probability.
(Click on image for 2K resolution).
4K resolution.
Compare to the previous day's image.
0.5K image
When available the active region map has a coronal hole polarity overlay where red (pink) is negative and blue is positive.
Data for all numbered solar regions according to the Solar Region Summary provided by NOAA/SWPC. Comments are my own, as is the STAR spot count (spots observed at or inside a few hours before midnight) and data for regions not numbered by SWPC or where SWPC has observed no spots. SWPC active region numbers in the table below and in the active region map above are the historic SWPC/USAF numbers.
| Active region | Date numbered detected |
Spot count | Location at midnight | Area | Classification | SDO / HMI 4K continuum image with magnetic polarity overlays |
Comment | ||||
|---|---|---|---|---|---|---|---|---|---|---|---|
| SWPC | Magnetic (SDO) |
SWPC | STAR | Current | Previous | ||||||
| 2K | 1K | ||||||||||
| 12490 |
2016.01.24 2016.01.25 |
10 | 26 | 12 | S21W56 | 0060 | DAO | DAI |
 |
 |
area: 0130 location: S19W56 |
| 12489 |
2016.01.24 2016.01.25 |
2 | 6 | 2 | N09W72 | 0200 | HAX | CAO |
 |
 |
area: 0220 |
| S5056 | 2016.01.26 | N25W54 | |||||||||
| S5061 | 2016.01.29 | 6 | 1 | N12W02 | 0012 | BXO | images/AR_S5061_20160203_2345.png |
 |
|||
| S5062 | 2016.01.29 | N10W57 | |||||||||
| S5064 | 2016.01.29 | 6 | N06W16 | 0010 | BXO |
 |
 |
||||
| 12491 |
2016.01.30 2016.01.31 |
6 | 29 | 13 | N03E30 | 0030 | DRO | DAI |
 |
 |
area: 0080 |
| S5066 | 2016.01.30 | N09W35 | |||||||||
| S5068 | 2016.01.30 | S21W34 | |||||||||
| S5069 | 2016.01.31 | S19W13 | |||||||||
| 12492 |
2016.02.01 2016.02.02 |
5 | 16 | 6 | N15E49 | 0060 | DSI | DAI |
 |
 |
|
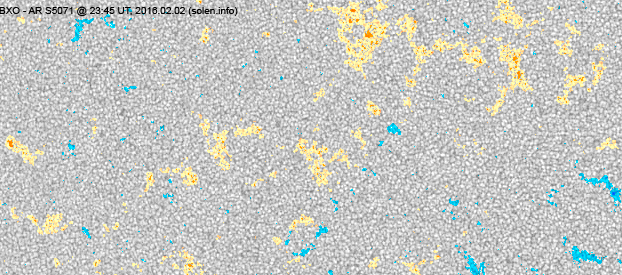
| S5071 | 2016.02.02 | S09E09 | images/AR_S5071_20160202_2345.png | ||||||||
| 12493 |
2016.02.02 2016.02.03 |
5 | 19 | 9 | S06W31 | 0030 | DAO | DAC |
 |
 |
area: 0090 |
| S5073 | 2016.02.02 | S10W36 |
 |
||||||||
| S5074 | 2016.02.03 | 22 | 11 | S12E23 | 0080 | DRI |
 |
||||
| S5076 | 2016.02.03 | 2 | 1 | N15E20 | 0005 | BXO |
 |
||||
| S5077 | 2016.02.03 | 8 | S14E10 | 0020 | BXO |
 |
|||||
| S5078 | 2016.02.03 | 10 | 4 | S08W18 | 0030 | CRI |
 |
||||
| S5079 | 2016.02.03 | 1 | S26W46 | 0001 | AXX |
 |
|||||
| S5080 | 2016.02.03 | 2 | N06E58 | 0002 | BXO |
 |
|||||
| Total spot count: | 28 | 153 | 59 | ||||||||
| Sunspot number: | 78 | 283 | 149 | (total spot count + 10 * number of spotted regions) | |||||||
| Weighted SN: | 51 | 184 | 90 | (Sum of total spot count + classification weighting for each AR. Classification weighting: X=0, R=3, A/S=5, H/K=10) | |||||||
| Relative sunspot number (Wolf number): | 86 | 156 | 127 | k * (sunspot number) As of July 1, 2015: k = 1.1 for SWPC, k = 0.55 for MSN 2K, k = 0.85 for MSN 1K (MSN=Magnetic Sunspot Number) |
|||||||
| Month | Average solar flux | International sunspot number (WDC-SILSO) (4) |
Smoothed sunspot number (4) | Average
ap (3) |
|
|---|---|---|---|---|---|
| Measured | 1 AU | ||||
| 2014.02 | 170.3 (cycle peak) |
166.3 | 146.1 (cycle peak) | 110.5 (+1.2) | 10.70 |
| 2014.04 | 143.9 | 144.8 | 112.5 | 116.4 (+2.1) (solar max) | 7.88 |
| 2014.12 | 158.7 | 153.8 | 112.9 | 92.2 (-2.5) | 11.24 |
| 2015.01 | 141.9 | 137.3 | 93.0 | 89.3 (-2.9) | 9.46 |
| 2015.02 | 129.1 | 126.0 | 66.7 | 86.1 (-3.2) | 9.92 |
| 2015.03 | 125.9 | 124.6 | 54.5 | 82.2 (-3.9) | 16.14 |
| 2015.04 | 128.8 | 129.7 | 75.3 | 78.8 (-3.4) | 10.73 |
| 2015.05 | 120.0 | 122.6 | 88.8 | 76.0 (-2.8) | 8.29 |
| 2015.06 | 122.3 | 126.1 | 66.5 | 72.0 (-4.0) | 13.15 |
| 2015.07 | 107.0 | 110.8 | 66.4 | 68.2 (-3.8) | 8.83 |
| 2015.08 | 105.4 | 108.0 | 64.6 | (66.1 projected, -2.1) | 14.58 |
| 2015.09 | 101.7 | 102.7 | 78.1 | (66.1 projected, +0.0) | 15.78 |
| 2015.10 | 104.1 | 103.3 | 61.7 | (65.7 projected, -0.4) | 14.02 |
| 2015.11 | 109.3 | 106.9 | 63.2 | (63.6 projected, -2.1) | 12.09 |
| 2015.12 | 113.1 | 109.5 | 57.7 | (61.9 projected, -1.7) | 14.29 |
| 2016.01 | 103.4 | 100.2 | 56.6 | (60.2 projected, -1.7) | 10.0 |
| 2016.02 | 104.8 | 5.9 (2A) / 57.3 (2B) / 75.0 (2C) | (57.8 projected, -2.4) | (7.7) | |
1) Running average based on the daily 20:00 UTC observed solar flux value at
2800 MHz.
2A) Current impact on the monthly sunspot number based on the Boulder
(NOAA/SWPC) sunspot number (accumulated daily sunspots / month days).
2B)
Boulder SN current month average to date.
2C) STAR SDO 1K Wolf number 30 day
average.
3) Running average based on the quicklook and definitive Potsdam WDC ap
indices. Values in red are based on the definitive
international
GFZ Potsdam
WDC
ap indices.
4) Updated to new data set from WDC-SILSO on July 1, 2015
This report has been prepared by Jan Alvestad. It is based on the analysis of data from whatever sources are available at the time the report is prepared. All time references are to Universal Time. Comments and suggestions are always welcome.
SDO images are courtesy of NASA/SDO and the AIA, EVE, and HMI science teams.