
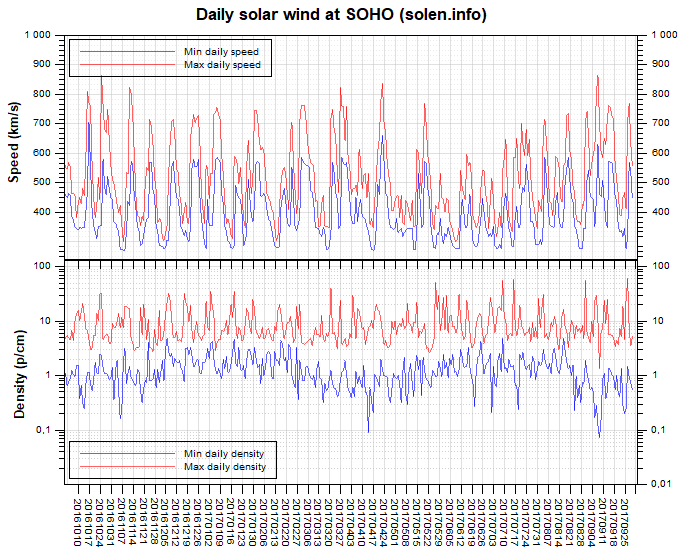
The geomagnetic field was quiet to severe storm on September 7. Solar wind speed at SOHO ranged between 446 and 806 km/s. Earth received a direct hit from the CME observed on September 6 after the X9 flare. A strong solar wind shock was observed at 22:38 at SOHO, which makes the transit time for this CME only 35 hours. The geomagnetic field was initially at severe to very severe storm levels.
Solar flux at 20h UTC on 2.8 GHz was 128.5 (increasing 58.7 over the previous solar rotation). The average 90 day 10.7 flux at 1 AU was 82.1. The Potsdam WDC planetary A index was 34 (STAR Ap - based on the mean of three hour interval ap indices: 34.3). Three hour interval K indices: 34333247 (planetary), 24454326 (Boulder)
The background x-ray flux is at the class B8 level.
At the time of counting spots (see image time), spots were observed in 6 active regions using 2K resolution (SN: 200) and in 6 active regions using 1K resolution (SN: 132) SDO images on the visible solar disk.
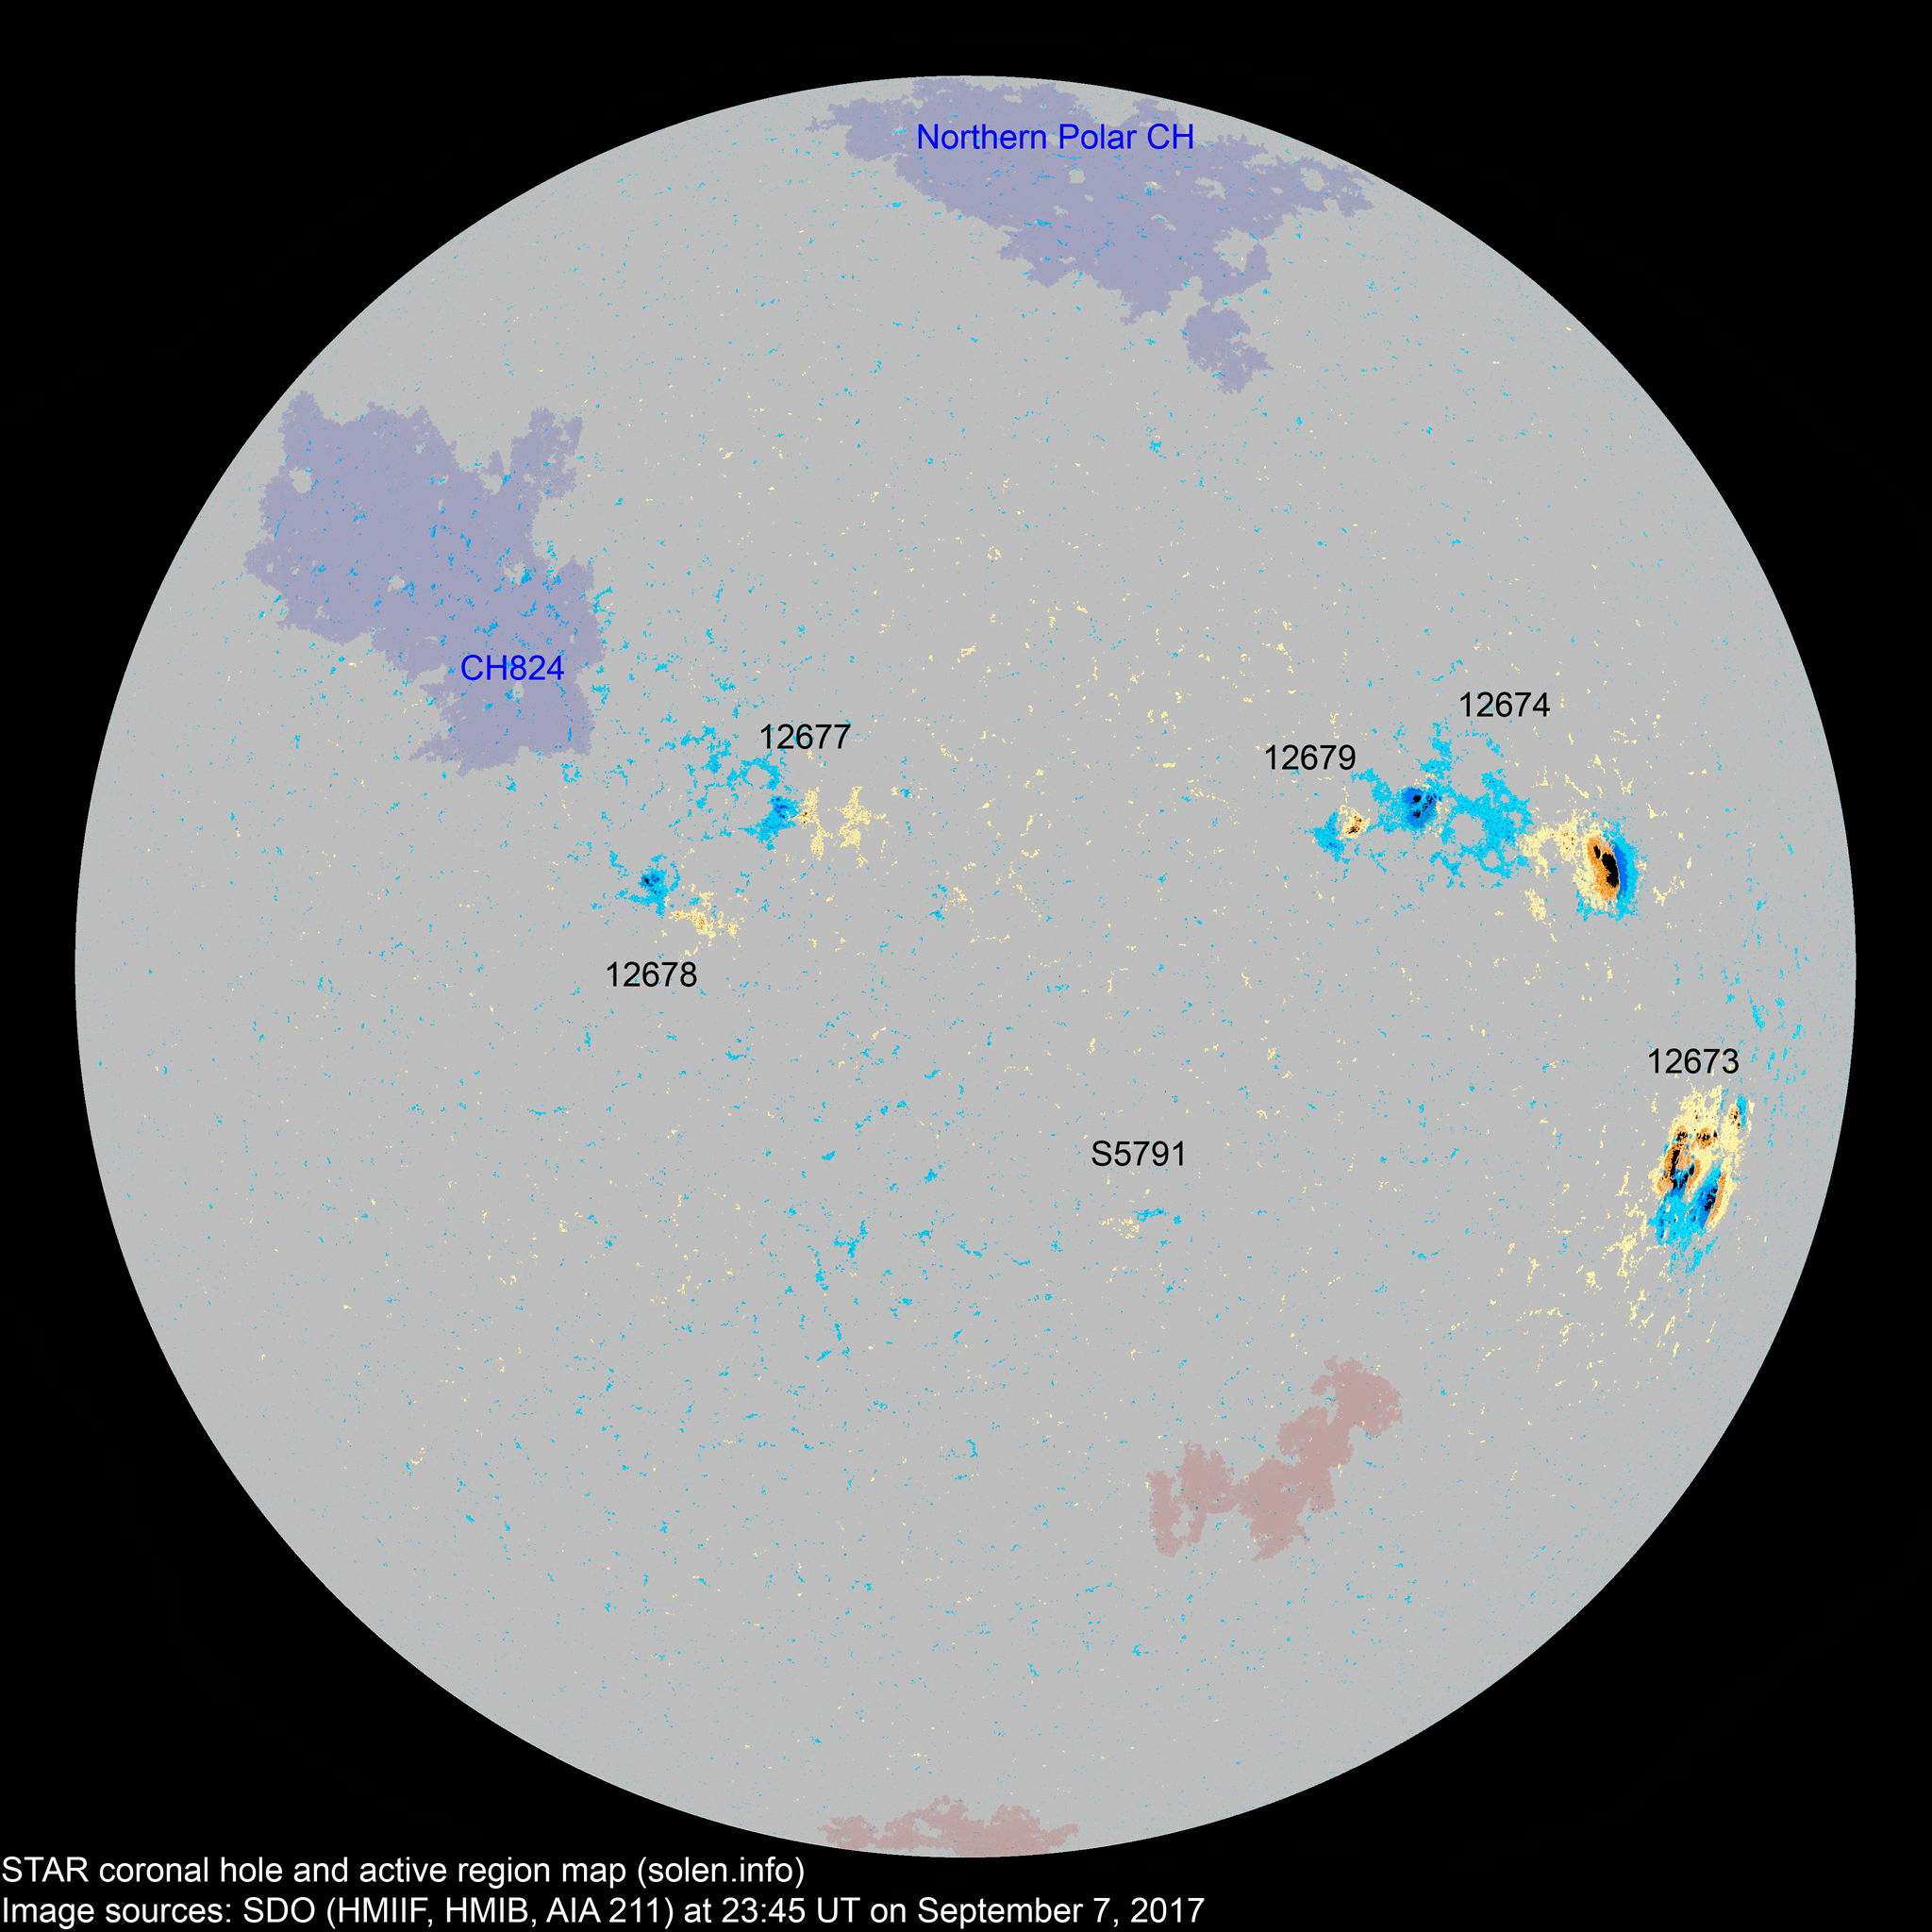
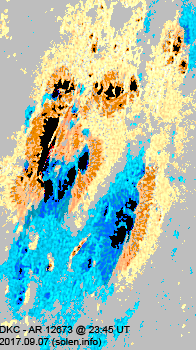
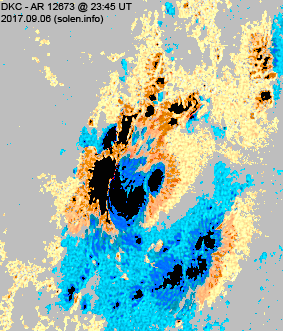
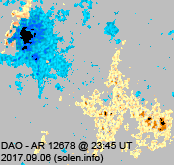
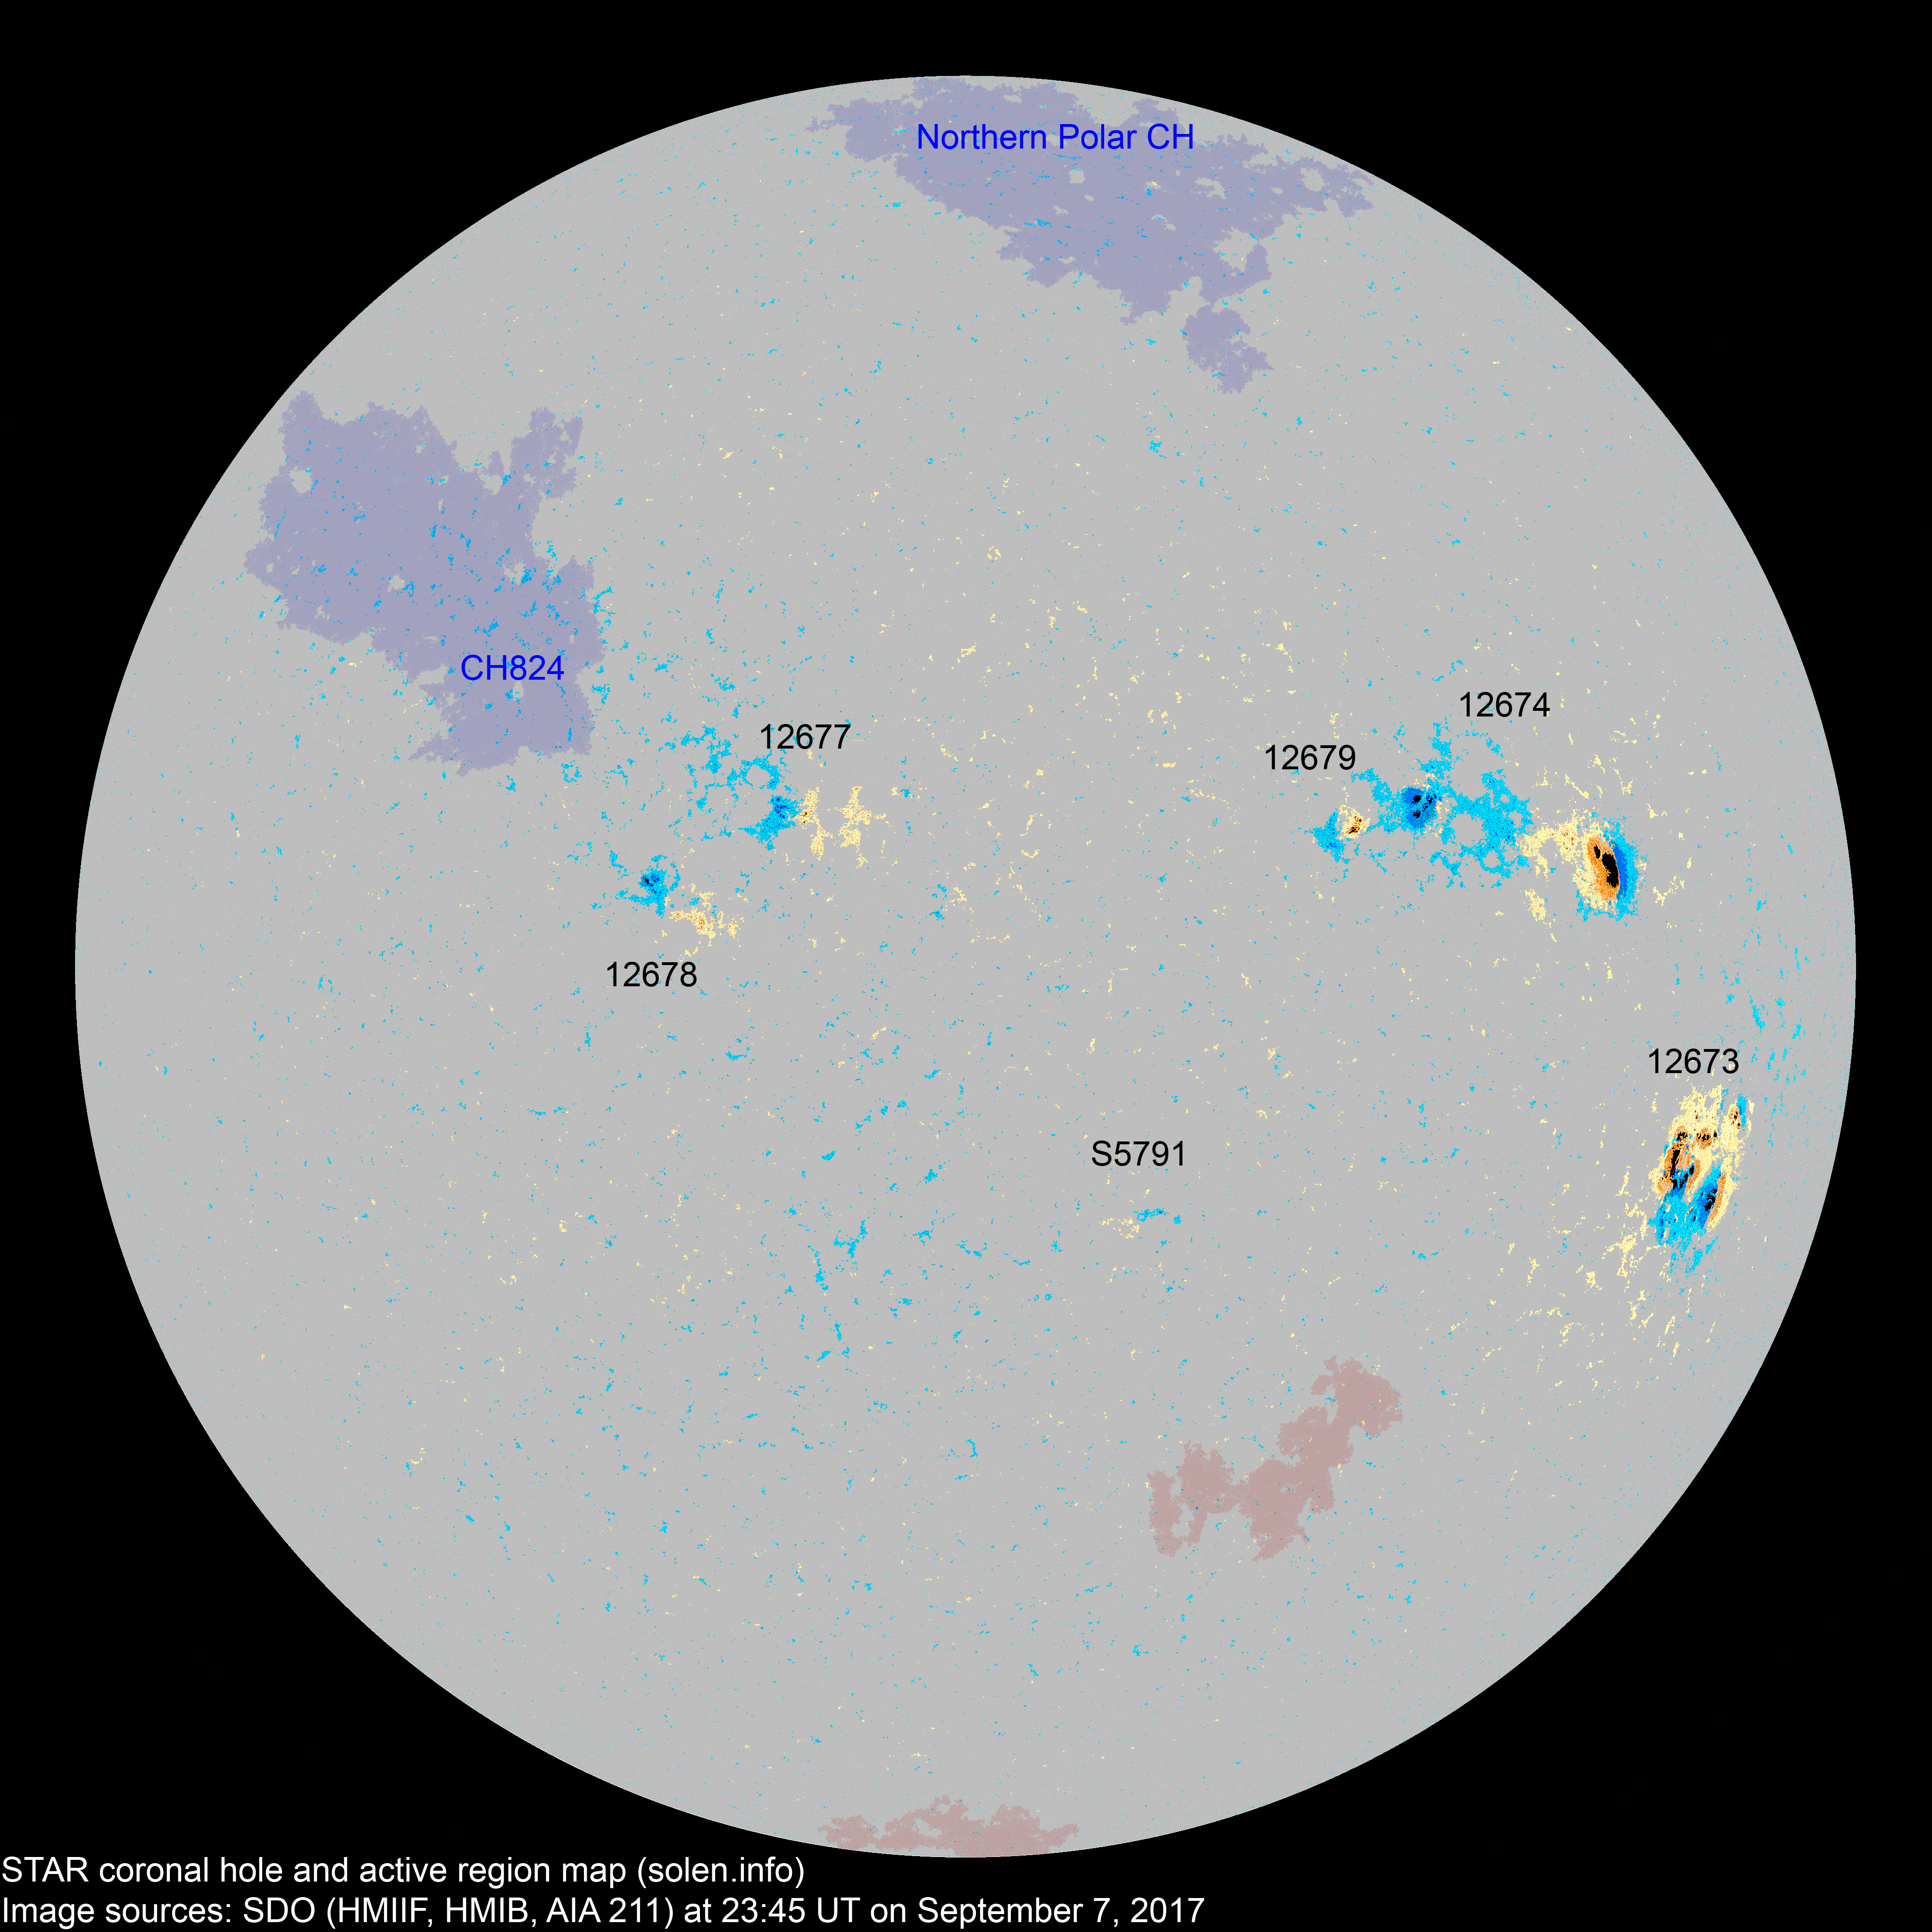
Region 12673 [S09W56] became slightly less complex
as opposite polarity umbrae within the same penumbra showed increased separation
and a shorter inversion line. Further X class events are possible until the
region rotates out of view. There is a chance for a strong proton flare as the
region approaches the southwest limb.
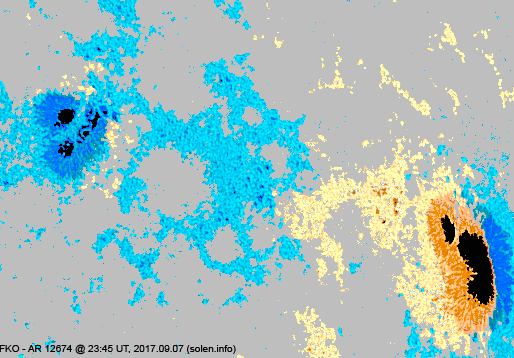
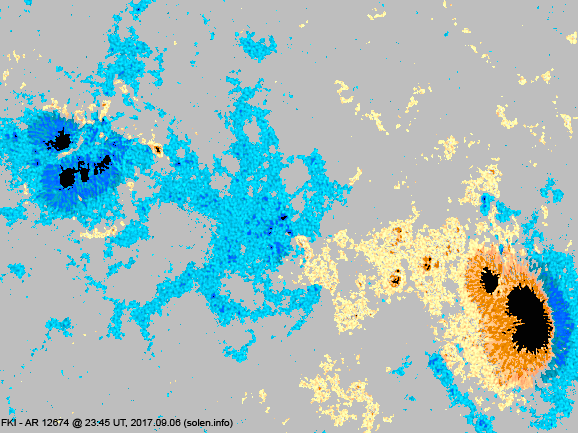
Region 12674 [N13W42] decayed slowly and quietly.
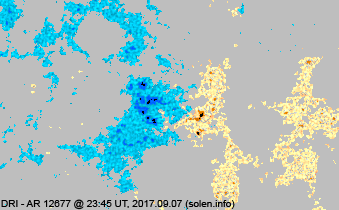
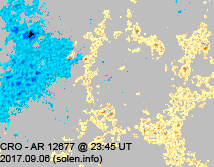
Region 12677 [N17E11] was quiet and stable.
Region 12678 [N10E20] was quiet and stable.
New region 12679 [N15W26] emerged on September 5 and was numbered by SWPC
2 days later.
Spotted regions not numbered (or interpreted differently)
by SWPC:
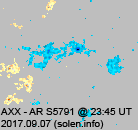
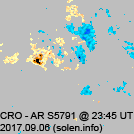
S5791 [S09W12] decayed slowly and quietly.
C2+ flares:
| Magnitude | Peak time (UT) | Location | AR | Recorded by | Comment |
| M2.4/1F | 05:02 | S07W45 | 12673 | GOES15 | |
| C8.2/1F | 06:28 | S08W46 | 12673 | GOES15 | |
| C2.3 | 09:20 | 12673 | GOES13 | ||
| M1.4/1N | 09:54 | S08W46 | 12673 | GOES15 | |
| M7.3 | 10:15 | 12673 | GOES15 | ||
| C3.0 | 12:14 | S08W48 | 12673 | GOES15 | |
| X1.3/2B | 14:36 | S08W51 | 12673 | GOES15 | |
| C5.2 | 18:28 | 12673 | GOES15 | ||
| C4.5 | 18:44 | 12673 | GOES15 | ||
| C2.5 | 20:57 | 12673 | GOES15 | ||
| C5.4 | 21:37 | 12673 | GOES15 | ||
| C2.7 | 23:00 | 12673 | GOES15 |
September 6: A large and fast CME was observed after
the X9 event in AR 12673. This CME reached Earth late on September 7 with a
transit time of 35 hours.
September 5,7: No obviously Earth directed CMEs were observed in available
LASCO imagery.
[Coronal hole
history (since October 2002)]
[Compare today's report to the situation one solar rotation ago:
28 days ago
27 days ago
26 days ago]
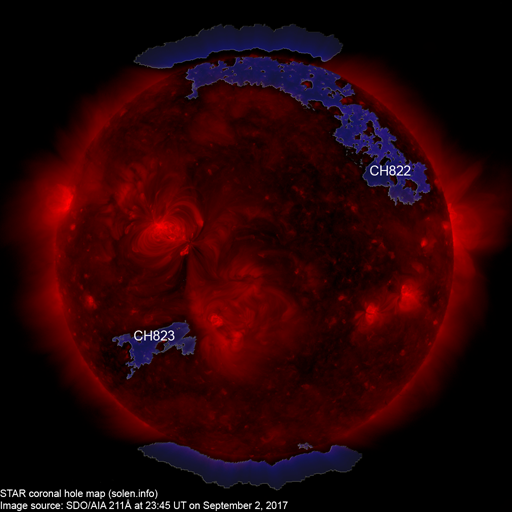
A recurrent southern hemisphere coronal hole (CH823) was in an Earth facing position on September 4-5. CH823 is not expected to produce any terrestrial effects due to the ongoing CME related disturbances. A recurrent northern hemisphere coronal hole (CH824) will likely rotate across the central meridian on September 10-12.
Long distance low and medium frequency (below 2 MHz) propagation along paths north of due west over upper middle latitudes is very poor. Propagation on long distance northeast-southwest paths is very poor.
The geomagnetic field is expected to be unsettled to major storm on September 7-9 due to CME effects.
| Coronal holes (1) | Coronal mass ejection (2) | M and X class flares (3) |
1) Effects from a coronal hole could reach Earth within the
next 5 days. When the high speed stream has arrived the color changes to green.
2) Effects from a CME are likely to be observed at Earth within 96 hours.
3) There is a possibility of either M or X class flares within the next 48
hours.
Green: 0-30% probability, Yellow: 30-70% probability, Red: 70-100% probability.
(Click on image for 2K resolution).
4K resolution.
Compare to the previous day's image.
0.5K image
When available the active region map has a coronal hole polarity overlay where red (pink) is negative and blue is positive.
Data for all numbered solar regions according to the Solar Region Summary provided by NOAA/SWPC. Comments are my own, as is the STAR spot count (spots observed at or inside a few hours before midnight) and data for regions not numbered by SWPC or where SWPC has observed no spots. SWPC active region numbers in the table below and in the active region map above are the historic SWPC/USAF numbers.
| Active region | Date numbered detected |
Spot count | Location at midnight | Area | Classification | SDO / HMI 4K continuum image with magnetic polarity overlays |
Comment | ||||
|---|---|---|---|---|---|---|---|---|---|---|---|
| SWPC | Magnetic (SDO) |
SWPC | STAR | Current | Previous | ||||||
| 2K | 1K | ||||||||||
| 12673 |
2017.08.28 2017.08.29 |
21 | 51 | 30 | S09W58 | 1000 | EKC | DKC |
 |
 |
location: S09W56 beta-gamma-delta |
| 12674 |
2017.08.28 2017.08.29 |
13 | 35 | 17 | N14W41 | 0600 | FKO | FKO |
 |
 |
|
| 12677 |
2017.09.02 2017.09.03 |
3 | 20 | 8 | N17E12 | 0010 | BXO | DRI |
 |
 |
area: 0035 |
| S5788 | 2017.09.02 | S10W09 | |||||||||
| 12678 |
2017.09.04 2017.09.05 |
3 | 13 | 10 | N11E18 | 0040 | HAX | CRI |
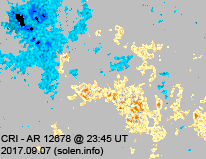 |
 |
|
| 12679 |
2017.09.05 2017.09.07 |
4 | 19 | 6 | N14W27 | 0010 | BXO | CRO |
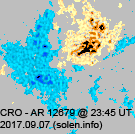 |
 |
area: 0040 |
| S5791 | 2017.09.06 | 2 | 1 | S09W12 | 0003 | AXX |
 |
 |
|||
| Total spot count: | 44 | 140 | 72 | ||||||||
| Sunspot number: | 94 | 200 | 132 | (total spot count + 10 * number of spotted regions) | |||||||
| Weighted SN: | 69 | 169 | 101 | (Sum of total spot count + classification weighting for each AR. Classification weighting: X=0, R=3, A/S=5, H/K=10) | |||||||
| Relative sunspot number (Wolf number): | 103 | 110 | 106 | k * (sunspot number) As of May 7, 2016: k = 1.1 for SWPC, k = 0.55 for MSN 2K, k = 0.80 for MSN 1K (MSN=Magnetic Sunspot Number) |
|||||||
| Month | Average solar flux | International sunspot number (WDC-SILSO) (4) |
Smoothed sunspot number (4) | Average
ap (3) |
|
|---|---|---|---|---|---|
| Measured | 1 AU | ||||
| 2014.02 | 170.3 (cycle peak) |
166.3 | 146.1 (cycle peak) | 110.5 (+1.2) | 10.70 |
| 2014.04 | 143.9 | 144.8 | 112.5 | 116.4 (+2.1) (solar max) | 7.88 |
| 2016.04 | 93.3 | 94.0 | 38.0 | 47.8 (-2.7) | 9.03 |
| 2016.05 | 93.0 | 95.3 | 52.1 | 44.9 (-2.9) | 11.65 |
| 2016.06 | 81.9 | 84.5 | 20.9 | 41.6 (-3.3) | 8.44 |
| 2016.07 | 86.0 | 88.9 | 32.5 | 38.6 (-3.0) | 9.43 |
| 2016.08 | 85.0 | 87.1 | 50.7 | 36.0 (-2.6) | 9.61 |
| 2016.09 | 87.7 | 88.7 | 44.7 | 33.3 (-2.7) | 14.54 |
| 2016.10 | 86.1 | 85.6 | 33.6 | 31.4 (-1.9) | 15.33 |
| 2016.11 | 78.6 | 76.9 | 21.4 | 29.9 (-1.5) | 9.11 |
| 2016.12 | 75.1 | 72.8 | 18.9 | 28.5 (-1.4) | 9.34 |
| 2017.01 | 77.3 | 74.9 | 25.8 | 27.9 (-0.6) | 9.45 |
| 2017.02 | 76.8 | 75.0 | 26.1 | 26.6 (-1.3) | 9.58 |
| 2017.03 | 74.6 | 73.9 | 17.7 | (25.0 projected, -1.6) | 14.20 |
| 2017.04 | 80.3 | 80.8 | 32.6 | (23.4 projected, -1.6) | 11.70 |
| 2017.05 | 73.6 | 75.2 | 18.8 | (22.3 projected, -1.1) | 8.09 |
| 2017.06 | 74.7 | 77.1 | 19.4 | (21.3 projected, -1.0) | 6.08 |
| 2017.07 | 77.4 | 79.9 | 18.3 | (20.2 projected, -1.1) | 8.97 |
| 2017.08 | 77.9 | 79.8 | 33.1 | (18.7 projected, -1.5) | 10.1 |
| 2017.09 | (117.7) | 20.8 (2A) / 92.3 (2B) / 49.1 (2C) | (17.5 projected, -1.2) | (15.4) | |
1) Running average based on the daily 20:00 UTC observed solar flux value at
2800 MHz.
2A) Current impact on the monthly sunspot number based on the Boulder
(NOAA/SWPC) sunspot number (accumulated daily sunspots / month days).
2B)
Boulder SN current month average to date.
2C) STAR SDO 1K Wolf number 30 day
average.
3) Running average based on the quicklook and definitive Potsdam WDC ap
indices. Values in red are based on the definitive
international
GFZ Potsdam
WDC
ap indices.
4) Updated to new data set from WDC-SILSO on July 1, 2015
This report has been prepared by Jan Alvestad. It is based on the analysis of data from whatever sources are available at the time the report is prepared. All time references are to Universal Time. Comments and suggestions are always welcome.
SDO images are courtesy of NASA/SDO and the AIA, EVE, and HMI science teams.