
Last update December 10, 2002 at 04:15 UTC. Last minor update posted at 12:48 UTC.
[Solar and geomagnetic data
- last 4 weeks (updated daily)]
[Solar wind and electron
fluence charts (updated daily)]
[Solar cycles 21-23 (last
update December 2, 2002)]
[Solar cycles 1-20]
[Graphical comparison of
cycles 21, 22 and 23 (last update December 2, 2002)]
[Graphical comparison of
cycles 10, 13, 17, 20 and 23 (last update December 2, 2002)]
[Historical solar and geomagnetic
data charts 1954-2002 (last update October 13, 2002)]
[Archived reports (last update December 9, 2002)]
The geomagnetic field was quiet to unsettled on December 9. Solar wind speed ranged between 452 and 548 km/sec.
Solar flare activity was low. Solar flux was 156.3, the planetary A
index was 8 (STAR Ap - based on the mean of three hour ap indices: 9.4).
Three hour interval K indices: 32122322 (planetary), 21212212 (Boulder).
The background x-ray flux is at the class C1 level.
At midnight there were 13 spotted regions on the visible disk, 1 of which has not yet been numbered. A total of 9 C class flares were recorded during the day.
Region 10205 rotated over the northwest limb. Flare: C1.1
at 22:04 UTC.
Region 10207 rotated quietly over the southwest limb.
Region 10209 decayed slowly and quietly.
Region 10212 decayed and lost about half of its penumbral area.
Region 10213 was quiet and stable.
Region 10214 decayed into spotless plage at the northwest limb.
Region 10215 developed a few new spots but lost some of its penumbral area.
Region 10216 decayed slowly and quietly and could soon become spotless.
Region 10217 decayed slowly as the only penumbra split off its smallest spot.
Region 10218 was mostly quiet and stable. Flare: C1.9
at 17:13 UTC.
New region 10219 emerged in the southeast quadrant on December 6 and was finally noticed by SEC on December 9. The region
developed a few small spots early in the day, however, these spots had disappeared by midnight. Flare: C1.5
at 06:32 UTC.
New region 10220 emerged in the southeast quadrant on December 8 and developed very quickly on December 9. The region has a
magnetic delta in the large trailing penumbra. M class flares are likely. Flares: C2.4 at
20:00, C4.1 at 21:37, C1.0 at 22:13 and C2.0 at 23:38 UTC. The region produced a C5.5 flare at 01:32 on December 10.
New region 10221 rotated into view at the northeast limb on December 8 and was numbered on Dec.9.
Spotted regions not yet numbered by SEC:
[S49] A new region emerged in the southeast quadrant on December 9. Location at midnight: S24E31.
Comment added at 11:22 UTC on December 10: A new region has emerged in the southeast quadrant and will be located at S07E15 at noon. This DAO region had 7 spots a short while ago. Currently 10 spotted regions are visible with several of the regions decaying. Region 10220 continues to develop but at a slower pace than yesterday.
Comment added at 12:48 UTC: Region 10220 produced an M1.1 flare at 12:26 UTC. It is not yet known if there was a CME associated with this event. Further M class flares are likely as long as the current magnetic delta configuration is present.
December 7-9: No obviously geoeffective CMEs noted.
Coronal hole history (starting late October 2002)
Compare today's report with the situation one solar rotation ago: 28 days ago
27 days ago 26 days ago
A fairly small, decaying, recurrent coronal hole in the southern hemisphere will rotate into a geoeffective position on December 10-11.

Processed SOHO EIT 284 image at 19:06 UTC on December 9. Any black areas on the solar disk are likely coronal holes.
The geomagnetic field is expected to be quiet to unsettled on December 10-13. A weak coronal stream will likely begin on December 13. Long distance medium wave (AM) band propagation along east-west paths over high and upper middle latitudes is fair to poor.
| Coronal holes (1) | Coronal mass ejections (2) | M and X class flares (3) |
1) Effects from a coronal hole could reach Earth within the
next 5 days.
2) Material from a CME is likely to impact Earth within 96 hours.
3) There is a possibility of either M or X class flares within the next 48
hours.
Green: 0-20% probability, Yellow: 20-60% probability, Red: 60-100% probability.
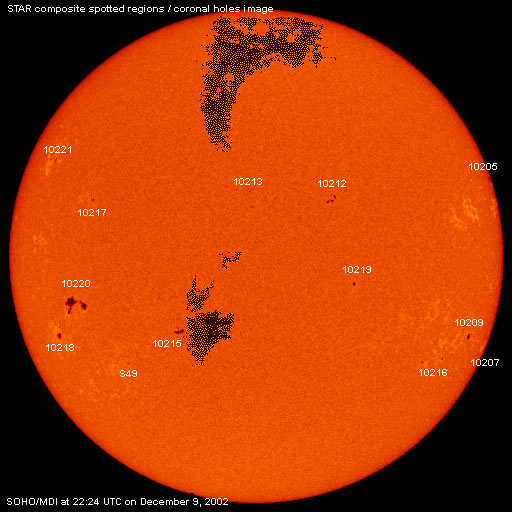
Composite image based on a SOHO/MDI continuum image and overlaid by a coronal hole image. Region numbering has been included.
Data for all numbered solar regions according to the Solar Region Summary provided by SEC/NOAA. Comments are my own, as is the STAR spot count (spots observed at or just prior to midnight) and data for regions not numbered by SEC or where SEC has observed no spots.
| Solar region | Date numbered | SEC spot count |
STAR spot count |
Location at midnight | Area | Classification | Comment |
|---|---|---|---|---|---|---|---|
| 10205 | 2002.11.27 | 2 | 1 | N20W88 | 0120 | CAO |
classification was HSX at midnight |
| 10207 | 2002.11.27 | 1 | 1 | S17W94 | 0050 | HSX | |
| 10208 | 2002.11.29 | N11W64 | plage | ||||
| 10209 | 2002.11.30 | 1 | 1 | S18W65 | 0060 | HAX | |
| 10211 | 2002.12.02 | S08W87 | plage | ||||
| 10212 | 2002.12.02 | 9 | 6 | N14W18 | 0060 | DAO | |
| 10213 | 2002.12.03 | 6 | 1 | N14E01 | 0020 | CSO |
classification was AXX at midnight |
| 10214 | 2002.12.05 | 3 | N13W83 | 0070 | BXO | now spotless | |
| 10215 | 2002.12.05 | 11 | 8 | S18E19 | 0040 | DAO |
area was approx. 0090 at midnight |
| 10216 | 2002.12.08 | 3 | 2 | S24W52 | 0050 | DAO |
area was 0030 at midnight |
| 10217 | 2002.12.08 | 4 | 2 | N12E43 | 0020 | HSX | |
| 10218 | 2002.12.08 | 2 | 3 | S20E55 | 0070 | HAX |
classification was CSO at midnight |
| 10219 | 2002.12.09 | 3 | 1 | S05W25 | 0020 | HAX | formerly region S43 |
| 10220 | 2002.12.09 | 12 | 19 | S12E47 | 0150 | DAO |
beta-gamma-delta formerly region S47 classification was DAI at midnight, area was just above 0300 then |
| 10221 | 2002.12.09 | 2 | 1 | N22E61 | 0020 | HSX | formerly region S48 |
| S42 | emerged on 2002.12.04 |
S10W47 | plage | ||||
| S49 | emerged on 2002.12.09 |
1 | S24E31 | 0010 | AXX | ||
| Total spot count: | 59 | 47 | |||||
| SSN: | 189 | 177 | |||||
| Month | Average solar flux at Earth |
International sunspot number | Smoothed sunspot number |
|---|---|---|---|
| 2000.04 | 184.2 | 125.5 | 120.8 cycle 23 sunspot max. |
| 2000.07 | 202.3 | 170.1 | 119.8 |
| 2001.11 | 210.6 | 106.5 | 115.5 (+1.5) |
| 2001.12 | 235.1 | 132.2 | 114.6 (-0.9) |
| 2002.01 | 226.6 | 114.1 | 113.5 (-1.1) |
| 2002.02 | 205.0 | 107.4 | 114.7 (+1.2) |
| 2002.03 | 179.5 | 98.4 | 113.4 (-1.3) |
| 2002.04 | 189.8 | 120.7 | 110.5 (-2.9) |
| 2002.05 | 178.4 | 120.8 | 108.8 (-1.7) |
| 2002.06 | 148.7 | 88.3 | (106.4 predicted, -2.4) |
| 2002.07 | 173.5 | 99.9 | (102.8 predicted, -3.6) |
| 2002.08 | 183.6 | 116.4 | (99.6 predicted, -3.2) |
| 2002.09 | 175.8 | 109.3 | (96.6 predicted, -3.0) |
| 2002.10 | 167.0 | 97.5 | (93.1 predicted, -3.5) |
| 2002.11 | 168.7 | 95.0 | (87.8 predicted, -5.3) |
| 2002.12 | 149.9 (1) | 40.0 (2) | (83.5 predicted, -4.3) |
1) Running average based on the daily 20:00 UT observed solar flux value at 2800
MHz.
2) Unofficial, accumulated value based on the Boulder (SEC/NOAA) sunspot number. The official
international sunspot number is typically 25-45% less.
This report has been prepared by Jan Alvestad. It is based partly on my own observations and interpretations, and partly on data from sources noted in solar links. Comments and suggestions are always welcome.
| [DX-Listeners' Club] [DX News] |