
Last update January 1, 2003 at 02:10 UTC.
[Solar and geomagnetic data
- last 4 weeks (updated daily)]
[Solar wind and electron
fluence charts (updated daily)]
[Solar cycles 21-23 (last
update December 2, 2002)]
[Solar cycles 1-20]
[Graphical comparison of
cycles 21, 22 and 23 (last update December 2, 2002)]
[Graphical comparison of
cycles 10, 13, 17, 20 and 23 (last update December 2, 2002)]
[Historical solar and geomagnetic
data charts 1954-2002 (last update October 13, 2002)]
[Archived reports (last update December 30, 2002)]
The geomagnetic field was quit to unsettled on December 31. Solar wind speed ranged between 395 and 472 km/sec.
Solar flux was 115.1. The planetary A
index was 11 (STAR Ap - based on the mean of three hour interval ap indices: 11.3).
Three hour interval K indices: 33233322 (planetary), 32122121 (Boulder).
The background x-ray flux is at the class B2 level.
At midnight there were 3 spotted regions on the visible disk. Solar flare activity was very low.
Region 10234 was mostly quiet and stable.
Region 10239 did not change much and was quiet.
New region 10240 emerged late on December 30 and was numbered the next day. The region appears to be decaying slowly.
December 29-31: No obviously geoeffective CMEs observed.
Coronal hole history (since late October 2002)
Compare today's report with the situation one solar rotation ago: 28
days ago
27 days ago 26 days ago
A recurrent trans equatorial coronal hole will rotate into a geoeffective position on December 31-January 1.
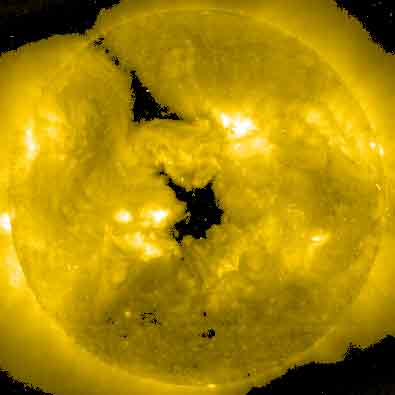
Processed SOHO EIT 284 image at 19:06 UTC on December 31. Any black areas on the solar disk are likely coronal holes.
The geomagnetic field is expected to be quiet to unsettled on January 1-2. A coronal stream will likely arrive on January 3 and cause unsettled to minor storm conditions. Long distance medium wave (AM) band propagation along east-west paths over high and upper middle latitudes is fair.
| Coronal holes (1) | Coronal mass ejections (2) | M and X class flares (3) |
1) Effects from a coronal hole could reach Earth within the
next 5 days.
2) Material from a CME is likely to impact Earth within 96 hours.
3) There is a possibility of either M or X class flares within the next 48
hours.
Green: 0-20% probability, Yellow: 20-60% probability, Red: 60-100% probability.
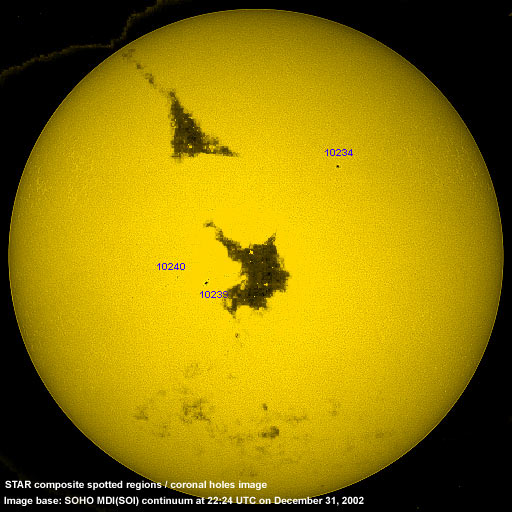
Composite image based on a SOHO/MDI continuum image and overlaid by a coronal hole image. Region numbering has been included. Compare to the previous day's image.
Data for all numbered solar regions according to the Solar Region Summary provided by SEC/NOAA. Comments are my own, as is the STAR spot count (spots observed at or inside a few hours before midnight) and data for regions not numbered by SEC or where SEC has observed no spots.
| Solar region | Date numbered | SEC spot count |
STAR spot count |
Location at midnight | Area | Classification | Comment |
|---|---|---|---|---|---|---|---|
| 10233 | 2002.12.23 | N13W64 | plage | ||||
| 10234 | 2002.12.24 | 1 | 1 | N20W21 | 0040 | HSX | |
| 10235 | 2002.12.25 | N14W48 | plage | ||||
| 10236 | 2002.12.27 | N16W79 | plage | ||||
| 10237 | 2002.12.28 | S26W39 | plage | ||||
| 10238 | 2002.12.28 | N09W24 | plage | ||||
| 10239 | 2002.12.29 | 12 | 10 | S10E10 | 0070 | DAO | |
| 10240 | 2002.12.30 | 7 | 5 | S06E20 | 0040 | DSO | formerly region S64 |
| S63 | emerged on 2002.12.29 |
S15W41 | plage | ||||
| Total spot count: | 20 | 16 | |||||
| SSN: | 50 | 46 | |||||
| Month | Average solar flux at Earth |
International sunspot number | Smoothed sunspot number |
|---|---|---|---|
| 2000.04 | 184.2 | 125.5 | 120.8 cycle 23 sunspot max. |
| 2000.07 | 202.3 | 170.1 | 119.8 |
| 2001.11 | 210.6 | 106.5 | 115.5 (+1.5) |
| 2001.12 | 235.1 | 132.2 | 114.6 (-0.9) |
| 2002.01 | 226.6 | 114.1 | 113.5 (-1.1) |
| 2002.02 | 205.0 | 107.4 | 114.7 (+1.2) |
| 2002.03 | 179.5 | 98.4 | 113.4 (-1.3) |
| 2002.04 | 189.8 | 120.7 | 110.5 (-2.9) |
| 2002.05 | 178.4 | 120.8 | 108.8 (-1.7) |
| 2002.06 | 148.7 | 88.3 | (106.4 predicted, -2.4) |
| 2002.07 | 173.5 | 99.9 | (102.8 predicted, -3.6) |
| 2002.08 | 183.6 | 116.4 | (99.6 predicted, -3.2) |
| 2002.09 | 175.8 | 109.3 | (96.6 predicted, -3.0) |
| 2002.10 | 167.0 | 97.5 | (93.1 predicted, -3.5) |
| 2002.11 | 168.7 | 95.0 | (87.8 predicted, -5.3) |
| 2002.12 | 157.2 (1) | 144.8 (2) | (83.5 predicted, -4.3) |
1) Running average based on the daily 20:00 UT observed solar flux value at 2800
MHz.
2) Unofficial, accumulated value based on the Boulder (SEC/NOAA) sunspot number. The official
international sunspot number is typically 25-45% less.
This report has been prepared by Jan Alvestad. It is based partly on my own observations and interpretations, and partly on data from sources noted in solar links. Comments and suggestions are always welcome.
| [DX-Listeners' Club] [DX News] |