
Last update December 5, 2002 at 03:50 UTC. Minor update posted at 11:16 UTC.
[Solar and geomagnetic data
- last 4 weeks (updated daily)]
[Solar wind and electron
fluence charts (updated daily)]
[Solar cycles 21-23 (last
update December 2, 2002)]
[Solar cycles 1-20]
[Graphical comparison of
cycles 21, 22 and 23 (last update December 2, 2002)]
[Graphical comparison of
cycles 10, 13, 17, 20 and 23 (last update December 2, 2002)]
[Historical solar and geomagnetic
data charts 1954-2002 (last update October 13, 2002)]
[Archived reports (last update December 1, 2002)]
The geomagnetic field was quiet to active on December 4. Solar wind speed ranged between 406 and 467 km/sec.
Solar flare activity was moderate. Solar flux was 148.7, the planetary A
index was 12 (STAR Ap - based on the mean of three hour ap indices: 13.3).
Three hour interval K indices: 22333432 (planetary), 12323332 (Boulder).
The background x-ray flux is at the class B4 level.
At midnight there were 8 spotted regions on the visible disk, 2 of which have not yet been numbered. Only 1 flare, an M class event, was recorded during the day.
Region 10203 decayed and was spotless by midnight.
Region 10205 decayed and could become spotless today.
Region 10207 decayed slowly and quietly.
Region 10208 was quiet and decayed in the trailing spot section. Several spots emerged in the leading spot section and a
magnetic delta structure formed there. An M class flare is possible.
Region 10209 was quiet and stable.
Region 10212 developed early in the day, then decayed slowly and quietly.
Region 10213 did not change much and was quiet with the exception of the unexpected M flare. Flare: M2.5/2N at
22:49 UTC. This event was associated with a weak type IV, a strong type II radio sweep and a small CME.
Spotted regions not yet numbered by SEC:
[S41] A new region emerged in the northwest quadrant during the afternoon. Location at midnight: N12W13.
[S42] A new region emerged early in the day in the southeast quadrant. Initially many spots were visible, then the region
began to decay and only a few small spots could be observed at midnight. Location at midnight: S10E18.
Comment added at 11:16 UTC on December 5: A new region has rotated into view at the southeast limb. Only a single HSX spot with an area estimated at 0070 mills has been observed so far. Region S41 has added several spots and is now a DAO region.
December 2-4: No obviously geoeffective CMEs noted.
Coronal hole history (starting late October 2002)
Compare today's report with the situation one solar rotation ago: -1 day
27 days ago +1 day
The southernmost part of an extension of the northern polar coronal hole may have been in a geoeffective position on December 4. A slowly developing trans equatorial coronal hole was in a geoeffective position on December 4.

Processed SOHO EIT 284 image at 19:06 UTC on December 4. Any black areas on the solar disk are likely coronal holes.
The geomagnetic field is expected to be quiet to unsettled on December 5-6 and quiet to active on December 7-8. Long distance medium wave (AM) band propagation along east-west paths over high and upper middle latitudes is fair to poor.
| Coronal holes (1) | Coronal mass ejections (2) | M and X class flares (3) |
1) Effects from a coronal hole could reach Earth within the
next 5 days.
2) Material from a CME is likely to impact Earth within 96 hours.
3) There is a possibility of either M or X class flares within the next 48
hours.
Green: 0-20% probability, Yellow: 20-60% probability, Red: 60-100% probability.
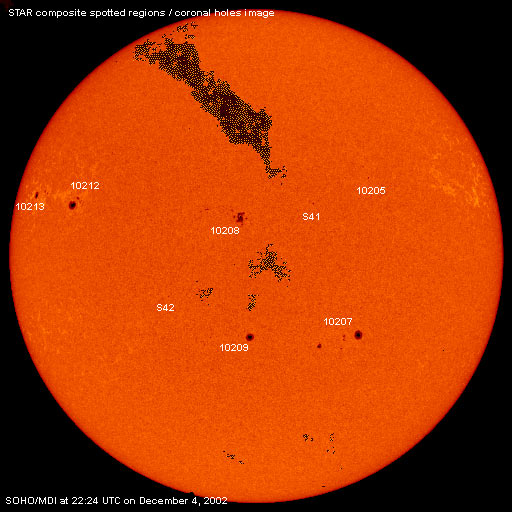
Composite image based on a SOHO/MDI continuum image and overlaid by a coronal hole image. Region numbering has been included.
Data for all numbered solar regions according to the Solar Region Summary provided by SEC/NOAA. Comments are my own, as is the STAR spot count (spots observed at or just prior to midnight) and data for regions not numbered by SEC or where SEC has observed no spots.
| Solar region | Date numbered | SEC spot count |
STAR spot count |
Location at midnight | Area | Classification | Comment |
|---|---|---|---|---|---|---|---|
| 10202 | 2002.11.24 | N12W64 | plage | ||||
| 10203 | 2002.11.26 | 3 | N07W34 | 0010 | BXO | now spotless | |
| 10204 | 2002.11.27 | N16W51 | plage | ||||
| 10205 | 2002.11.27 | 5 | 2 | N20W29 | 0020 | CRO |
classification was BXO at midnight |
| 10206 | 2002.11.27 | S27W48 | plage | ||||
| 10207 | 2002.11.27 | 15 | 13 | S19W21 | 0210 | EAO | |
| 10208 | 2002.11.29 | 26 | 31 | N10E08 | 0140 | EAI | beta-gamma-delta |
| 10209 | 2002.11.30 | 11 | 5 | S19E07 | 0120 | CSO | |
| 10211 | 2002.12.02 | S08W22 | plage | ||||
| 10212 | 2002.12.02 | 9 | 11 | N13E49 | 0180 | DAO | |
| 10213 | 2002.12.03 | 5 | 4 | N14E64 | 0090 | CAO | |
| S41 | emerged on 2002.12.04 |
3 | N12W13 | 0010 | CRO | ||
| S42 | emerged on 2002.12.04 |
2 | S10E18 | 0010 | AXX | ||
| Total spot count: | 74 | 71 | |||||
| SSN: | 144 | 151 | |||||
| Month | Average solar flux at Earth |
International sunspot number | Smoothed sunspot number |
|---|---|---|---|
| 2000.04 | 184.2 | 125.5 | 120.8 cycle 23 sunspot max. |
| 2000.07 | 202.3 | 170.1 | 119.8 |
| 2001.11 | 210.6 | 106.5 | 115.5 (+1.5) |
| 2001.12 | 235.1 | 132.2 | 114.6 (-0.9) |
| 2002.01 | 226.6 | 114.1 | 113.5 (-1.1) |
| 2002.02 | 205.0 | 107.4 | 114.7 (+1.2) |
| 2002.03 | 179.5 | 98.4 | 113.4 (-1.3) |
| 2002.04 | 189.8 | 120.7 | 110.5 (-2.9) |
| 2002.05 | 178.4 | 120.8 | 108.8 (-1.7) |
| 2002.06 | 148.7 | 88.3 | (106.4 predicted, -2.4) |
| 2002.07 | 173.5 | 99.9 | (102.8 predicted, -3.6) |
| 2002.08 | 183.6 | 116.4 | (99.6 predicted, -3.2) |
| 2002.09 | 175.8 | 109.3 | (96.6 predicted, -3.0) |
| 2002.10 | 167.0 | 97.5 | (93.1 predicted, -3.5) |
| 2002.11 | 168.7 | 95.0 | (87.8 predicted, -5.3) |
| 2002.12 | 147.6 (1) | 17.1 (2) | (83.5 predicted, -4.3) |
1) Running average based on the daily 20:00 UT observed solar flux value at 2800
MHz.
2) Unofficial, accumulated value based on the Boulder (SEC/NOAA) sunspot number. The official
international sunspot number is typically 25-45% less.
This report has been prepared by Jan Alvestad. It is based partly on my own observations and interpretations, and partly on data from sources noted in solar links. Comments and suggestions are always welcome.
| [DX-Listeners' Club] [DX News] |