
Last update issued on April 24, 2003 at 03:10 UTC.
[Solar and geomagnetic data - last 4 weeks (updated daily)]
[Solar wind and electron fluence charts (updated daily)]
[Solar cycles 21-23 (last update April 2, 2003)]
[Solar cycles 1-20]
[Graphical comparison of cycles 21, 22 and 23 (last update April 2, 2003)]
[Graphical comparison of cycles 10, 13, 17, 20 and 23 (last update April 2, 2003)]
[Historical solar and geomagnetic data charts 1954-2003 (last update April 13, 2003)]
[Archived reports (last update April 21, 2003)]
The geomagnetic field was quiet to minor storm on April 23. Solar wind speed ranged between 454 and 565 km/sec.
Solar flux measured at 20h UTC on 2.8 GHz was 132.8. The planetary A
index was 18 (STAR Ap - based on the mean of three hour interval ap indices: 17.9).
Three hour interval K indices: 24543333 (planetary), 14433333 (Boulder).
The background x-ray flux is at the class B4 level.
At midnight there were 6 spotted regions on the visible disk. Solar flare activity was high. A total of 6 C and 2 M class events was recorded during the day. Region 10339 at the northwest limb produced a C2.2 flare at 03:22, a C3.4 flare at 05:36, a C1.1 flare at 09:17 and a C5.8 flare at 12:13 UTC.
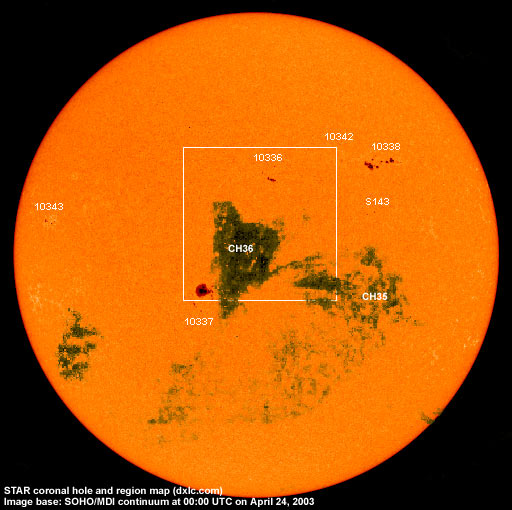
Region 10336 decayed slightly in the main penumbral areas. A few new spots emerged.
Region 10337 developed slowly and quietly with the large penumbra adding further to its size. There is a small positive
polarity field with spots southwest of the main (negative polarity) penumbra, otherwise the region has a magnetically simple
layout.
Region 10338 lost some of its small spots while the general layout of the region did not change much. There are still two
magnetic delta structures, the major one being in the largest trailing penumbra. Minor M class flares are possible. Flares:
C2.2 at 00:50, M5.1/1N (associated with a moderate type II and a weak type IV radio sweeps) at 01:06, C1.9 at 10:35 and an M2.0/1F
at 15:56 UTC.
Region 10342 decayed slightly and could soon become spotless.
New region 10343 emerged near the northeast limb and is developing slowly.
Spotted regions not yet numbered by SEC/NOAA:
[S143] A new region emerged on April 23 in the northwest quadrant south of region 10338. Location at midnight: N04W28.
April 21: A rather faint partial halo CME was observed in LASCO images after the M2.8 flare in region 10338 at 13:07 UTC. No obvious traces of ejected material were observed below the south pole or off of the southeast limb. The CME could reach Earth on April 23 or 24 and cause active geomagnetic conditions.
April 22: No obviously geoeffective CMEs observed.
April 23: A partial halo CME was observed in LASCO images after the M5.1 flare in region 10338 early in the day. The major part of the ejected material was observed off of the northwest limb. While Earth will be outside of the reaches of the main body of the CME, there is a possibility of a minor impact from the southern CME flank on April 25.
Coronal hole history (since late October 2002)
Compare today's report with the situation one solar rotation ago: 28
days ago 27 days ago 26
days ago
A decaying, recurrent coronal hole (CH35) in the southern hemisphere was in a geoeffective position on April 21-22. A recurrent trans equatorial coronal hole (CH36) was in a geoeffective position on April 23-24.

Processed SOHO EIT 284 image at 19:06 UTC on April 23. Any black areas on the solar disk are likely coronal holes.
The geomagnetic field is expected to be quiet to active on April 24 and unsettled to active on April 25 due to a high speed stream from coronal hole CH35. A high speed stream from coronal hole CH36 will likely arrive on April 26 and cause unsettled to minor storm conditions that day with unsettled to active on April 27. Long distance medium wave (AM) band propagation along east-west paths over high and upper middle latitudes is very poor, a condition which is likely to persist until at least April 28. Propagation along north-south paths is poor and will likely be poor to fair until at least April 28. [Trans Atlantic propagation conditions are currently monitored every night on 1470 kHz. Dominant station tonight: Radio Cristal del Uruguay.]
| Coronal holes (1) | Coronal mass ejections (2) | M and X class flares (3) |
1) Effects from a coronal hole could reach Earth within the next 5 days.
2) Material from a CME is likely to impact Earth within 96 hours.
3) There is a possibility of either M or X class flares within the next 48 hours.
Green: 0-20% probability, Yellow: 20-60% probability, Red: 60-100% probability.
Compare to the previous day's image.
Data for all numbered solar regions according to the Solar Region Summary provided by SEC/NOAA. Comments are my own, as is the STAR spot count (spots observed at or inside a few hours before midnight) and data for regions not numbered by SEC or where SEC has observed no spots.
| Solar region | Date numbered | SEC spot count |
STAR spot count |
Location at midnight | Area | Classification | Comment |
|---|---|---|---|---|---|---|---|
| 10335 | 2003.04.10 | S24W69 | plage | ||||
| 10336 | 2003.04.17 | 6 | 7 | N13W03 | 0060 | CSO | |
| 10337 | 2003.04.18 | 19 | 18 | S14E15 | 0310 | DKO | beta-gamma |
| 10338 | 2003.04.19 | 31 | 24 | N18W32 | 0170 | EAI | beta-gamma-delta |
| 10339 | 2003.04.20 | 5 | N16W84 | 0060 | CSO | rotated out of view | |
| 10340 | 2003.04.21 | 2 | S06E30 | 0010 | HSX | now spotless | |
| 10341 | 2003.04.21 | 1 | S10E50 | 0010 | AXX | now spotless | |
| 10342 | 2003.04.22 | 4 | 4 | N18W21 | 0020 | AXX | |
| 10343 | 2003.04.23 | 4 | 6 | N06E60 | 0030 | CRO |
classification was DSO at midnight |
| S140 | emerged on 2003.04.18 |
N07W70 | plage | ||||
| S143 | emerged on 2003.04.23 |
3 | N04W28 | 0010 | BXO | ||
| Total spot count: | 72 | 62 | |||||
| SSN: | 152 | 122 | |||||
| Month | Average solar flux at Earth |
International sunspot number | Smoothed sunspot number |
|---|---|---|---|
| 2000.04 | 184.2 | 125.5 | 120.8 cycle 23 sunspot max. |
| 2000.07 | 202.3 | 170.1 | 119.8 |
| 2001.12 | 235.1 | 132.2 | 114.6 (-0.9) |
| 2002.03 | 179.5 | 98.4 | 113.3 (-1.3) |
| 2002.04 | 189.8 | 120.7 | 110.5 (-2.9) |
| 2002.05 | 178.4 | 120.8 | 108.8 (-1.7) |
| 2002.06 | 148.7 | 88.3 | 106.2 (-2.6) |
| 2002.07 | 173.5 | 99.6 | 102.7 (-3.5) |
| 2002.08 | 183.6 | 116.4 | 98.7 (-4.0) |
| 2002.09 | 175.8 | 109.6 | 94.6 (-4.1) |
| 2002.10 | 167.0 | 97.5 | (91.0 predicted, -3.6) |
| 2002.11 | 168.7 | 95.0 | (85.7 predicted, -5.3) |
| 2002.12 | 157.2 | 81.6 | (81.3 predicted, -4.4) |
| 2003.01 | 144.0 | 79.5 | (78.3 predicted, -3.0) |
| 2003.02 | 124.5 | 46.2 | (73.3 predicted, -5.0) |
| 2003.03 | 131.4 | 61.5 | (67.6 predicted, -5.7) |
| 2003.04 | 120.1 (1) | 71.3 (2) | (62.7 predicted, -4.9) |
1) Running average based on the daily 20:00 UTC observed solar flux value at 2800 MHz.
2) Unofficial, accumulated value based on the Boulder (SEC/NOAA) sunspot number. The official international sunspot number is typically 25-45% less.
This report has been prepared by Jan Alvestad. It is based partly on my own observations and interpretations, and partly on data from sources noted in solar links. All time references are to the UTC day. Comments and suggestions are always welcome.
| [DX-Listeners' Club] |