
Last update issued on March 29, 2003 at 04:40 UTC.
[Solar and geomagnetic data - last 4 weeks (updated daily)]
[Solar wind and electron fluence charts (updated daily)]
[Solar cycles 21-23 (last update March 3, 2003)]
[Solar cycles 1-20]
[Graphical comparison of cycles 21, 22 and 23 (last update March 3, 2003)]
[Graphical comparison of cycles 10, 13, 17, 20 and 23 (last update March 3, 2003)]
[Historical solar and geomagnetic data charts 1954-2002 (last update January 27, 2003)]
[Archived reports (last update March 24, 2003)]
The geomagnetic field was quiet to minor storm on March 28. Solar wind speed ranged between 456 and 538 km/sec under the influence of a high speed stream. At about 15:25 UTC another disturbance was observed beginning at ACE. Since then the interplanetary magnetic field has been weakly to moderately southwards and this caused an increase in disturbance levels towards the end of the day and early on March 29.
Solar flux measured at 20h UTC on 2.8 GHz was 146.9. The planetary A
index was 24 (STAR Ap - based on the mean of three hour interval ap indices: 25.1).
Three hour interval K indices: 5452 3445 (planetary) (it should be noted that SEC/NOAA reports Kp as 4 for the 00-03 UTC
interval, however, this value is based only on the 00-02 UTC interval as they, for reasons unknown, lost the data for the last
hour of the interval. Based on data from relevant magnetometers, the Ap for the 00-03h UTC interval has been estimated at 45),
54422424 (Boulder).
The background x-ray flux is at the class B5 level.
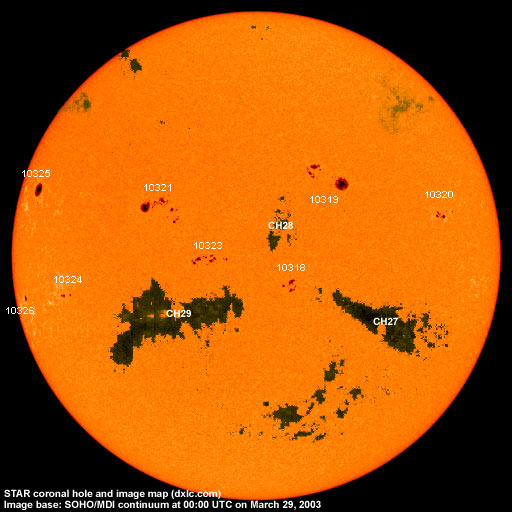
At midnight there were 8 spotted regions on the visible disk. Solar flare activity was very low.
Region 10318 lost its trailing spots. A positive polarity field emerged within the leading negative polarity field
causing quick development in this part of the region. The region currently has a magnetic delta structure in the northernmost
penumbra. A minor M class flare is becoming a possibility.
Region 10319 decayed slowly and quietly.
Region 10320 developed fairly quickly late in the day as new flux emerged in both polarities. Some polarity intermixing
is evident and the region could become interesting if the current development persists.
Region 10321 decayed slowly and quietly.
Region 10323 developed quickly with many new spots emerging in both polarities. While the region at this time is simply
structured, further development could change this.
Region 10324 was quiet and stable.
Region 10325 developed a few small spots and was quiet.
New region 10326 rotated into view at the southeast limb.
March 26-28: No obviously geoeffective CMEs observed.
Coronal hole history (since late October 2002)
Compare today's report with the situation one solar rotation ago: 28
days ago 27 days ago 26
days ago
A coronal hole (CH27) in the southern hemisphere was in a geoeffective position on March 25-27, this coronal hole is best defined in the section due west of region 10318. A small coronal hole (CH28) in the northern hemisphere was in a geoeffective position on March 28. A coronal hole (CH29) in the southern hemisphere will be in a possibly geoeffective position on March 29-30.

Processed SOHO EIT 284 image at 01:06 UTC on March 29. Any black areas on the solar disk are likely coronal holes.
The geomagnetic field is expected to be quiet to minor storm on March 29 and quiet to active March 30-April 2 due to high speed streams from coronal holes CH27, CH28 and CH29. Long distance medium wave (AM) band propagation along east-west paths over high and upper middle latitudes is very poor, propagation along north-south paths is fair. [Trans Atlantic propagation conditions are currently monitored every night on 1470 kHz. Dominant station tonight: Radio Cristal del Uruguay (Venezuela), then Radio Rafaela (Argentina). A good opening towards Colombia and Venezuela was noted above 1350 kHz 04-06 UTC on March 28.]
| Coronal holes (1) | Coronal mass ejections (2) | M and X class flares (3) |
1) Effects from a coronal hole could reach Earth within the next 5 days.
2) Material from a CME is likely to impact Earth within 96 hours.
3) There is a possibility of either M or X class flares within the next 48 hours.
Green: 0-20% probability, Yellow: 20-60% probability, Red: 60-100% probability.
Compare to the previous day's image.
Data for all numbered solar regions according to the Solar Region Summary provided by SEC/NOAA. Comments are my own, as is the STAR spot count (spots observed at or inside a few hours before midnight) and data for regions not numbered by SEC or where SEC has observed no spots.
| Solar region | Date numbered | SEC spot count |
STAR spot count |
Location at midnight | Area | Classification | Comment |
|---|---|---|---|---|---|---|---|
| 10316 | 2003.03.18 | S11W67 | plage | ||||
| 10318 | 2003.03.22 | 11 | 14 | S15W06 | 0030 | DSO |
beta-gamma-delta classification was DAO at midnight, area 0070 |
| 10319 | 2003.03.23 | 32 | 21 | N12W18 | 0440 | EKI |
classification was EKO at midnight, area 0300 |
| 10320 | 2003.03.24 | 11 | 14 | N06W48 | 0030 | CSO |
beta-gamma classification was DAO at midnight, area 0060 |
| 10321 | 2003.03.24 | 38 | 30 | N04E21 | 0370 | EAC |
beta-gamma area was 0220 at midnight |
| 10323 | 2003.03.25 | 12 | 24 | S09E11 | 0030 | DSO |
classification was DAI at midnight, area 0090 |
| 10324 | 2003.03.27 | 3 | 3 | S14E53 | 0060 | DAO |
classification was HSX at midnight, area 0040 only negative polarity spots |
| 10325 | 2003.03.27 | 1 | 3 | N12E65 | 0260 | HHX |
classification was CHO at midnight |
| 10326 | 2003.03.28 | 1 | 1 | S12E74 | 0060 | HSX |
classification was HAX at midnight |
| S126 | emerged on 2003.03.24 |
S08W60 | now spotless | ||||
| S127 | emerged on 2003.03.24 |
S17W63 | plage | ||||
| Total spot count: | 109 | 110 | |||||
| SSN: | 189 | 190 | |||||
| Month | Average solar flux at Earth |
International sunspot number | Smoothed sunspot number |
|---|---|---|---|
| 2000.04 | 184.2 | 125.5 | 120.8 cycle 23 sunspot max. |
| 2000.07 | 202.3 | 170.1 | 119.8 |
| 2001.12 | 235.1 | 132.2 | 114.6 (-0.9) |
| 2002.02 | 205.0 | 107.4 | 114.6 (+1.2) |
| 2002.03 | 179.5 | 98.4 | 113.3 (-1.3) |
| 2002.04 | 189.8 | 120.7 | 110.5 (-2.9) |
| 2002.05 | 178.4 | 120.8 | 108.8 (-1.7) |
| 2002.06 | 148.7 | 88.3 | 106.2 (-2.6) |
| 2002.07 | 173.5 | 99.6 | 102.7 (-3.5) |
| 2002.08 | 183.6 | 116.4 | 98.7 (-4.0) |
| 2002.09 | 175.8 | 109.6 | (94.7 predicted, -4.0) |
| 2002.10 | 167.0 | 97.5 | (91.2 predicted, -3.5) |
| 2002.11 | 168.7 | 95.0 | (86.0 predicted, -5.2) |
| 2002.12 | 157.2 | 81.6 | (81.6 predicted, -4.4) |
| 2003.01 | 144.0 | 79.5 | (78.6 predicted, -3.0) |
| 2003.02 | 124.5 | 46.2 | (73.6 predicted, -5.0) |
| 2003.03 | 129.1 (1) | 103.3 (2) | (67.9 predicted, -5.7) |
1) Running average based on the daily 20:00 UTC observed solar flux value at 2800 MHz.
2) Unofficial, accumulated value based on the Boulder (SEC/NOAA) sunspot number. The official international sunspot number is typically 25-45% less.
This report has been prepared by Jan Alvestad. It is based partly on my own observations and interpretations, and partly on data from sources noted in solar links. All time references are to the UTC day. Comments and suggestions are always welcome.
| [DX-Listeners' Club] |